JUNE 9 2025
Using MCP to learn new developer tools
Hands-on with the Dgraph MCP server for getting started with graph data
One reason that I'm so excited about MCP is the ability to learn new developer tools interactively. In this post we'll take a look at using the Dgraph MCP server with Hypermode and Claude Desktop to explore, load, and visualize graph data. We'll start by using the Dgraph MCP server to generate fictitious sample data for an ecommerce company, explore it with Claude Desktop, and then generate personalized recommendations based on the data using graph traversals.
Getting started with Hypermode Graph MCP
As of Dgraph v25 each Dgraph cluster serves two Dgraph MCP endpoints, one for read-only access and another that includes tools for updating the graph. Once we provision a new graph instance in Hypermode we connect its remote MCP server to MCP host applications like Claude Desktop, Windsurf, Cursor, or any other MCP client using the MCP server connection configuration found in your Hypermode Graph details page.
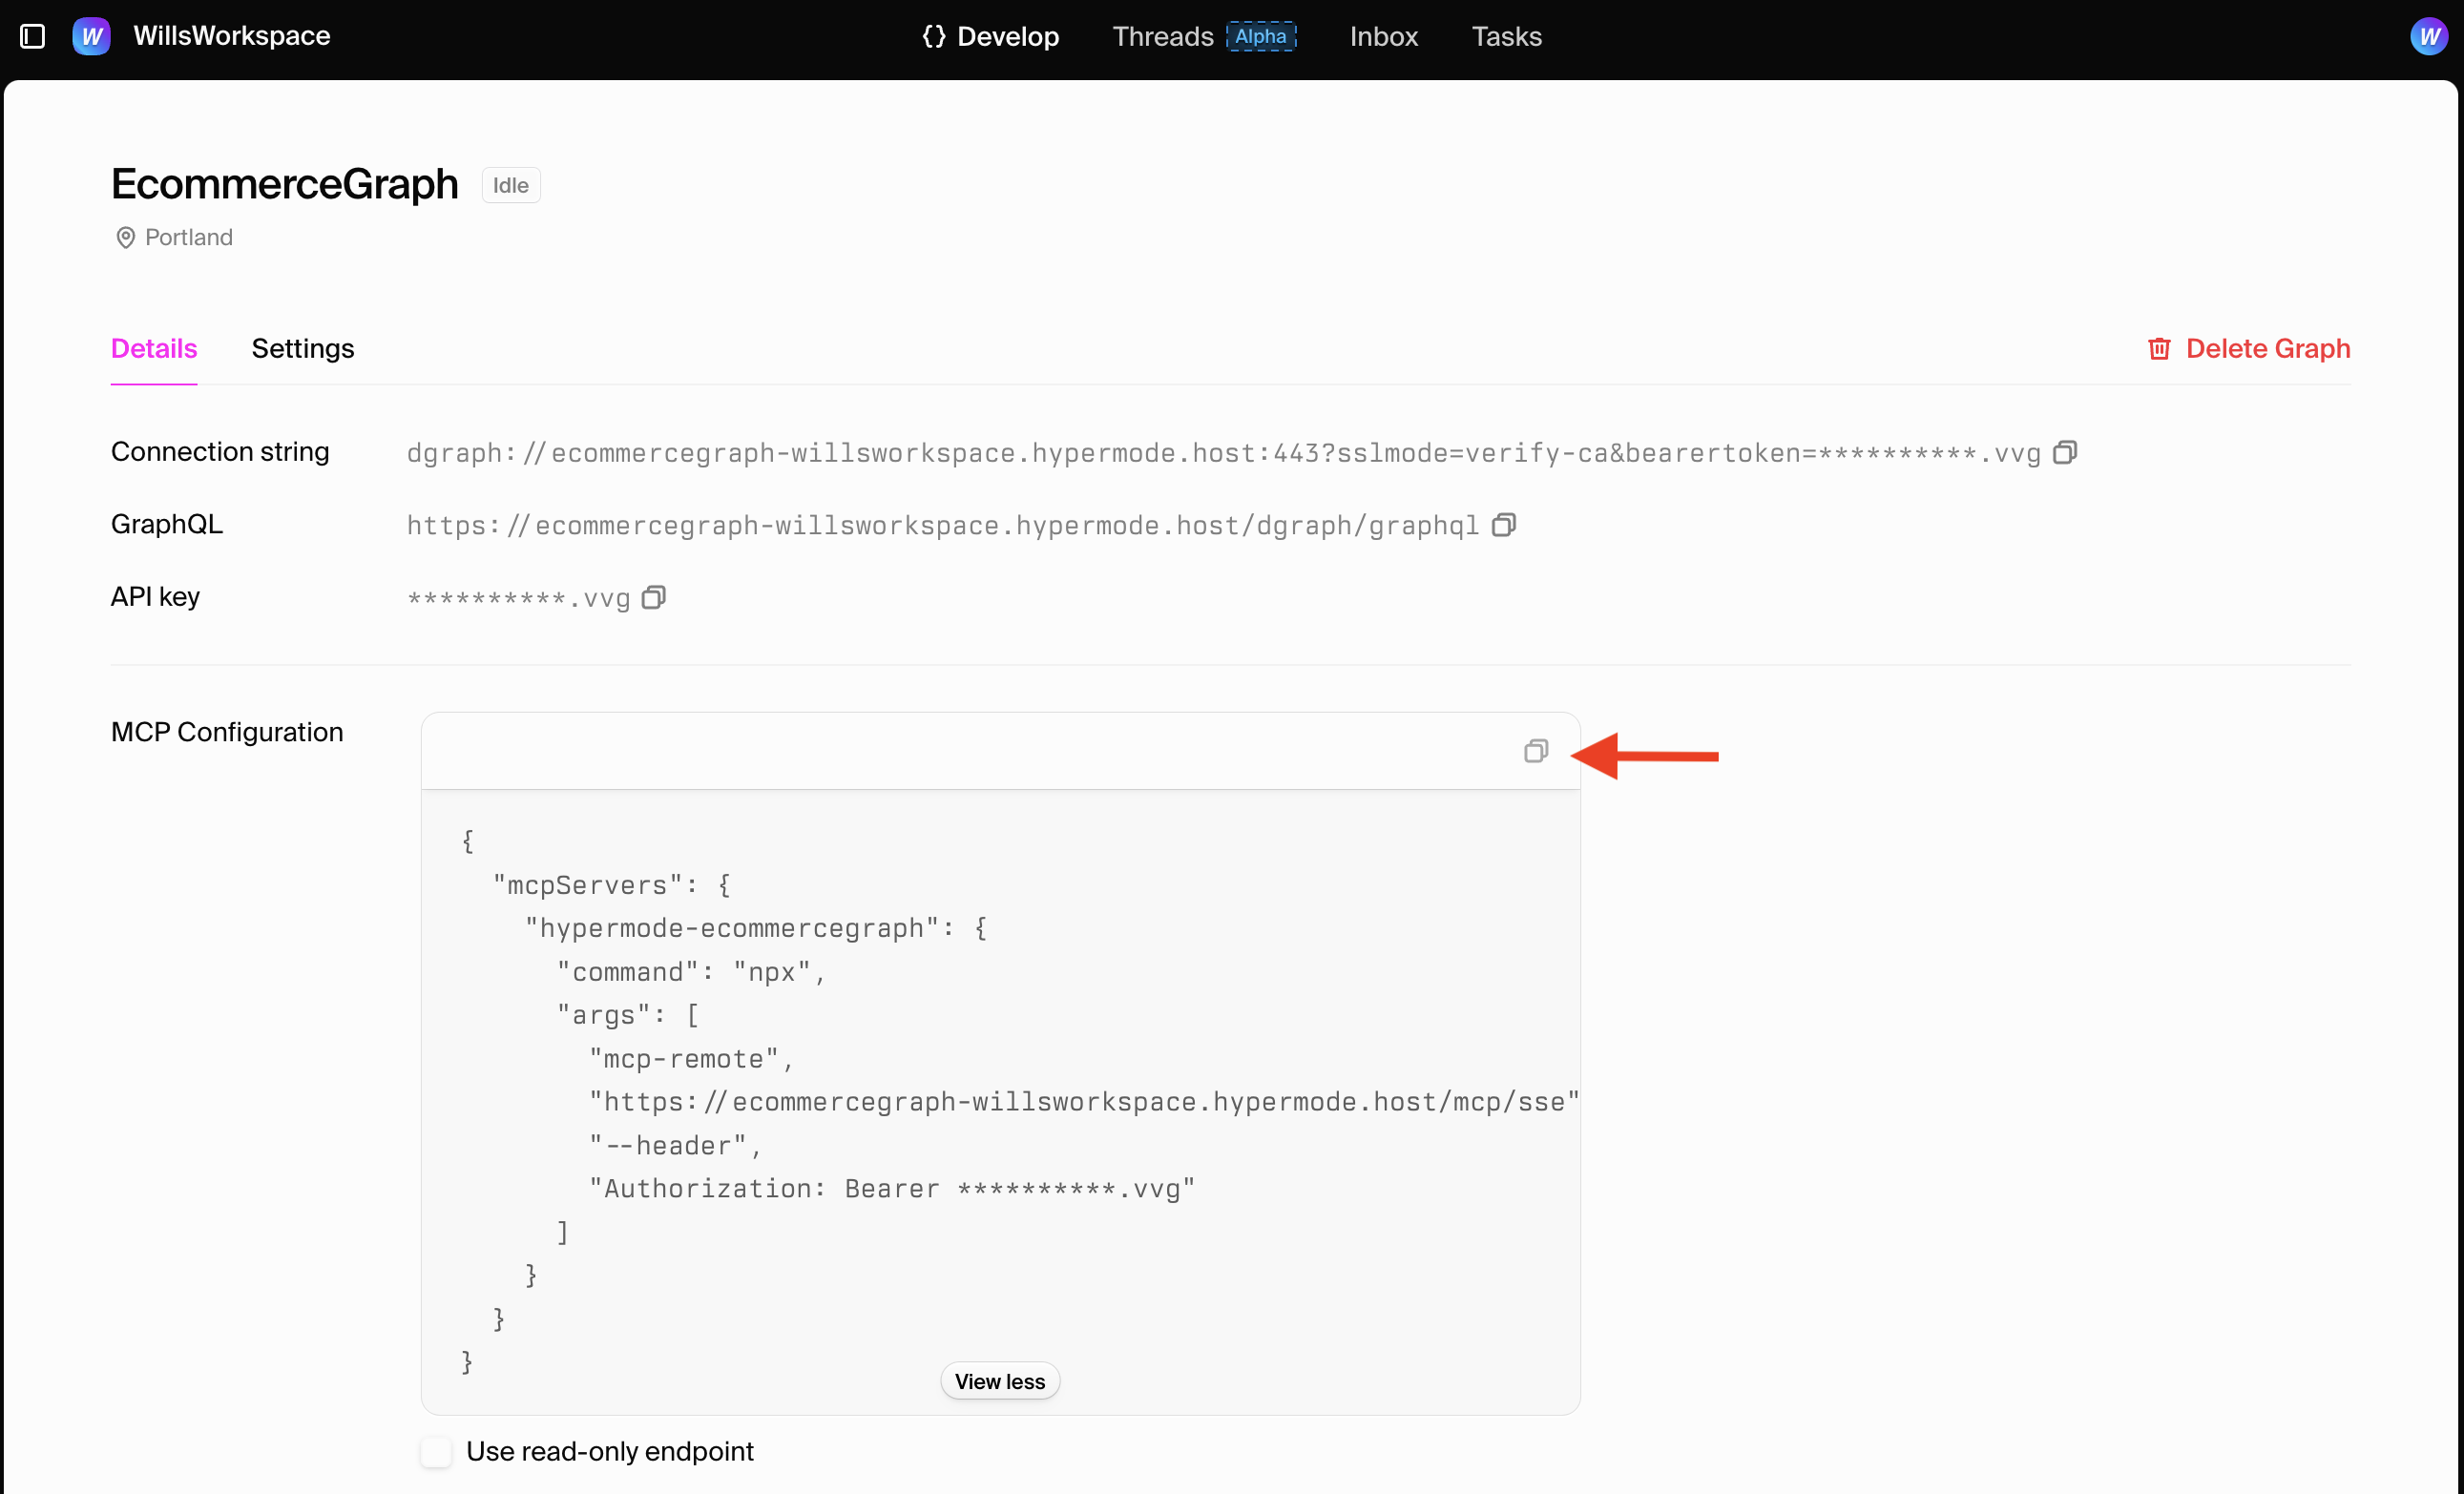
The connection configuration will look something like this and include a bearer token for authentication.
{
  "mcpServers": {
    "hypermode-ecommercegraph": {
      "command": "npx",
      "args": [
        "mcp-remote",
        "https://<your-graph-name>.hypermode.host/mcp/sse",
        "--header",
        "Authorization: Bearer **************"
      ]
    }
  }
}
Refer to the Hypermode Graph MCP docs page for more information on MCP server configuration.
In this example we'll be using the Dgraph MCP server to generate fictitious sample data for an e-commerce company, explore it with Claude Desktop, and then use graph traversals to generate personalized recommendations based on the data.
Connect the Hypermode Graph MCP server to Claude Desktop
Claude Desktop is an application from Anthropic that allows you to interact with Claude AI models directly from your computer and includes support for MCP servers which allows Claude to connect to external tools and services.
To connect Claude Desktop to our Hypermode Graph MCP server we'll open the
Developer Settings in Claude Desktop, click Edit, open the
claude_desktop_config.json file and paste in the MCP connection configuration
we copied from Hypermode above.
Reload Claude Desktop to register our new MCP server. After reloading, you should see new tools appear in Claude Desktop, representing the capabilities of our MCP server. This connection allows Claude to communicate directly with our Dgraph instance, enabling data exploration and manipulation of our graph directly from Claude Desktop.
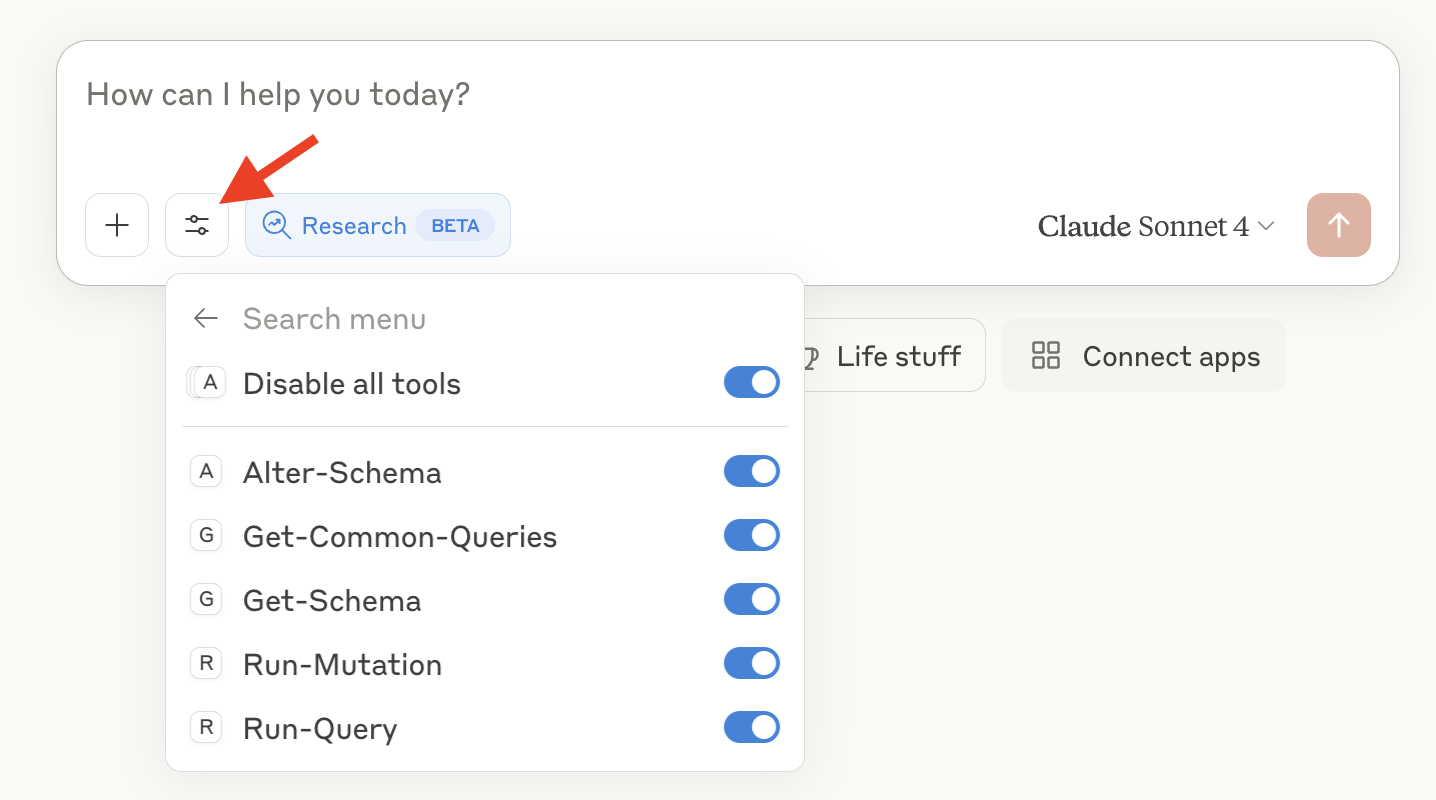
We can see the following tools are exposed to Claude:
get_schema: Retrieve the current schema of your graph database.run_query: Run a DQL query on your graph database.run_mutation: Run a DQL mutation on your graph database.alter_schema: Modify the DQL schema of your graph database.get_common_queries: Get common queries for your graph database.
Generate sample data
Since our graph is empty, let's use Claude to generate some sample data. We'll ask Claude to generate a graph that matches typical e-commerce data structures (customers, products, orders) and populate our graph with sample data.
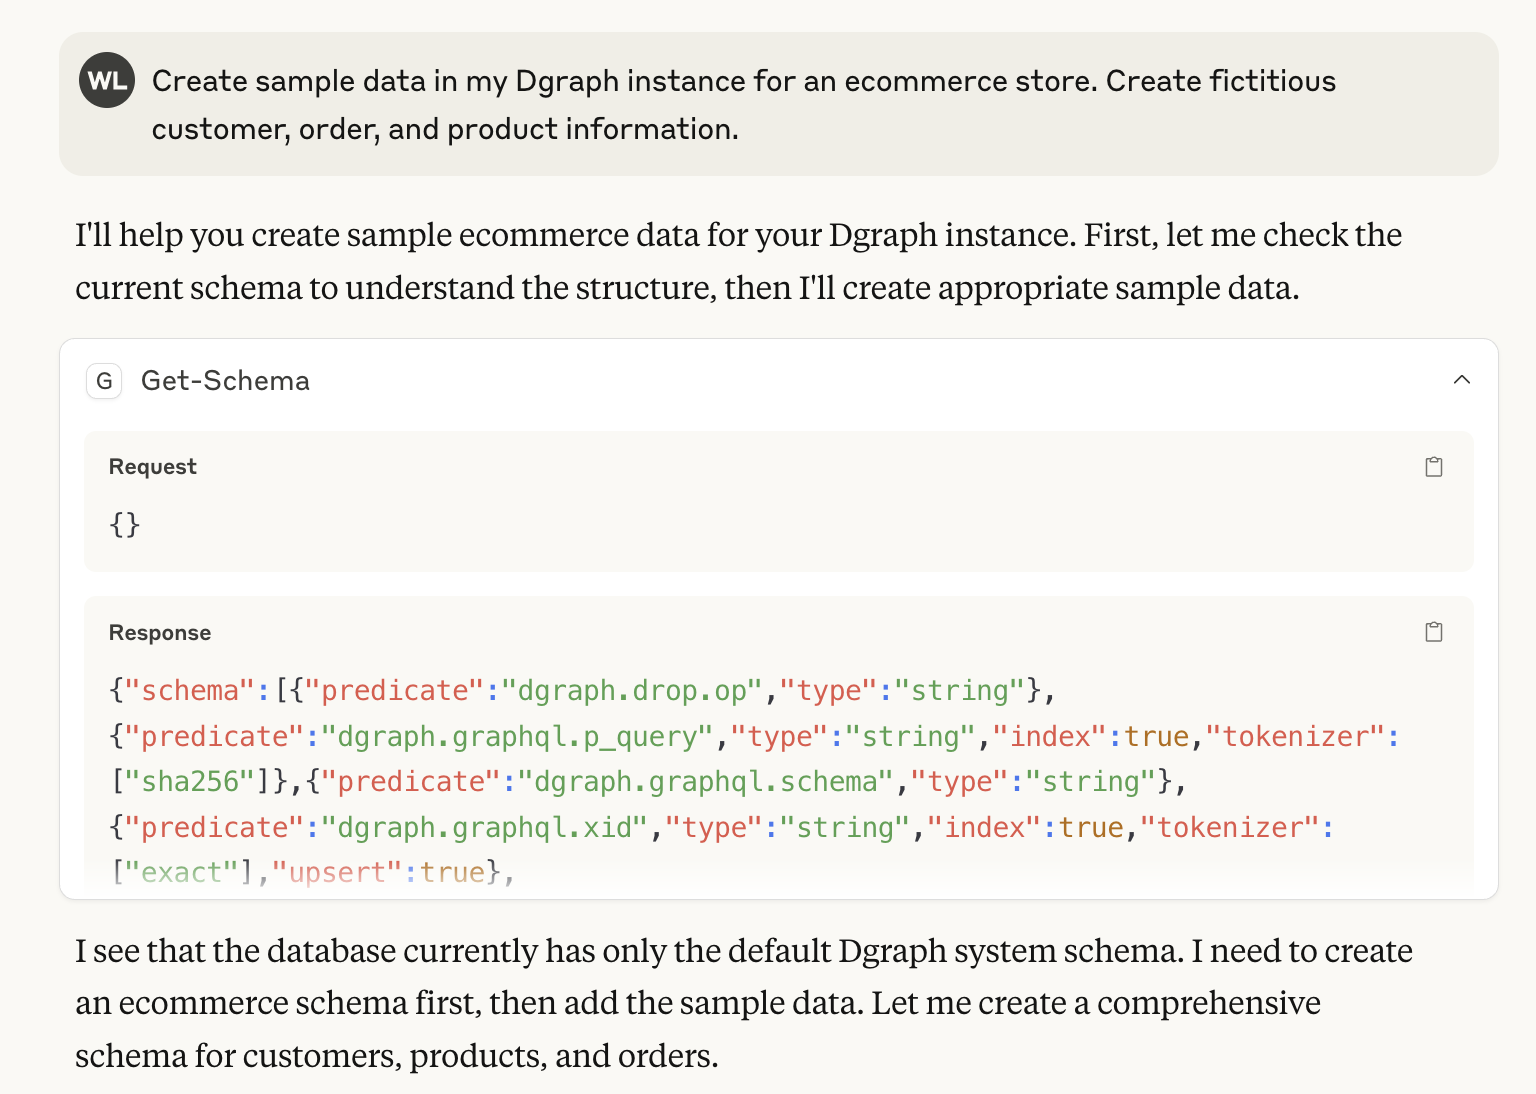
First, Claude inspects our database schema. Since this is a new graph, the schema is blank. Claude then creates a new schema that includes typical e-commerce data (customers, products, and orders).
# Customer schema
name: string @index(term, fulltext) .
email: string @index(exact) @upsert .
phone: string .
address: string .
city: string @index(term) .
state: string @index(term) .
zipcode: string @index(exact) .
created_at: datetime @index(year) .

# Product schema
product_name: string @index(term, fulltext) .
description: string @index(fulltext) .
price: float @index(float) .
category: string @index(term) .
brand: string @index(term) .
sku: string @index(exact) @upsert .
stock_quantity: int .
image_url: string .
created_date: datetime @index(year) .

# Order schema
order_date: datetime @index(year) .
total_amount: float @index(float) .
status: string @index(exact) .
shipping_address: string .
payment_method: string @index(exact) .

# Relationships
customer: [uid] @reverse .
products: [uid] @reverse .
ordered_by: [uid] @reverse .
contains: [uid] @reverse .

# Order items (many-to-many relationship between orders and products)
quantity: int .
unit_price: float .

# Types
type Customer {
  name
  email
  phone
  address
  city
  state
  zipcode
  created_at
}

type Product {
  product_name
  description
  price
  category
  brand
  sku
  stock_quantity
  image_url
  created_date
}

type Order {
  order_date
  total_amount
  status
  shipping_address
  payment_method
  ordered_by
  contains
}

type OrderItem {
  quantity
  unit_price
  products
}
Using the tools provided by the MCP server, Claude generates and executes mutations to populate our graph with sample data. The LLM (in this case Claude Sonnet 4) is responsible for generating the actual database queries. The MCP server provides the tools that allow Claude to execute these queries, fetch the schema, and understand the structure of our database.
Claude then uses the run_mutation tool to populate our graph with sample data.
Claude also runs queries to check if the expected data exists in the graph. If
any data is missing or not as expected, Claude automatically generates new DQL
queries to fix the issues. This iterative process continues until all the sample
data - customers, products, and orders - are correctly loaded. We can see the
results of each tool call, giving us confidence that our database is set up
properly.
Visualize graph data for exploratory data analysis
Visualizing graph data is an important aspect of exploratory data analysis. Once our data is loaded we can ask Claude to generate a graph visualization of our data. Claude can generate interactive graph visualizations inside Claude Desktop using the Artifacts feature.
Visualizing your graph helps you understand the relationships between entities and spot patterns in your data.
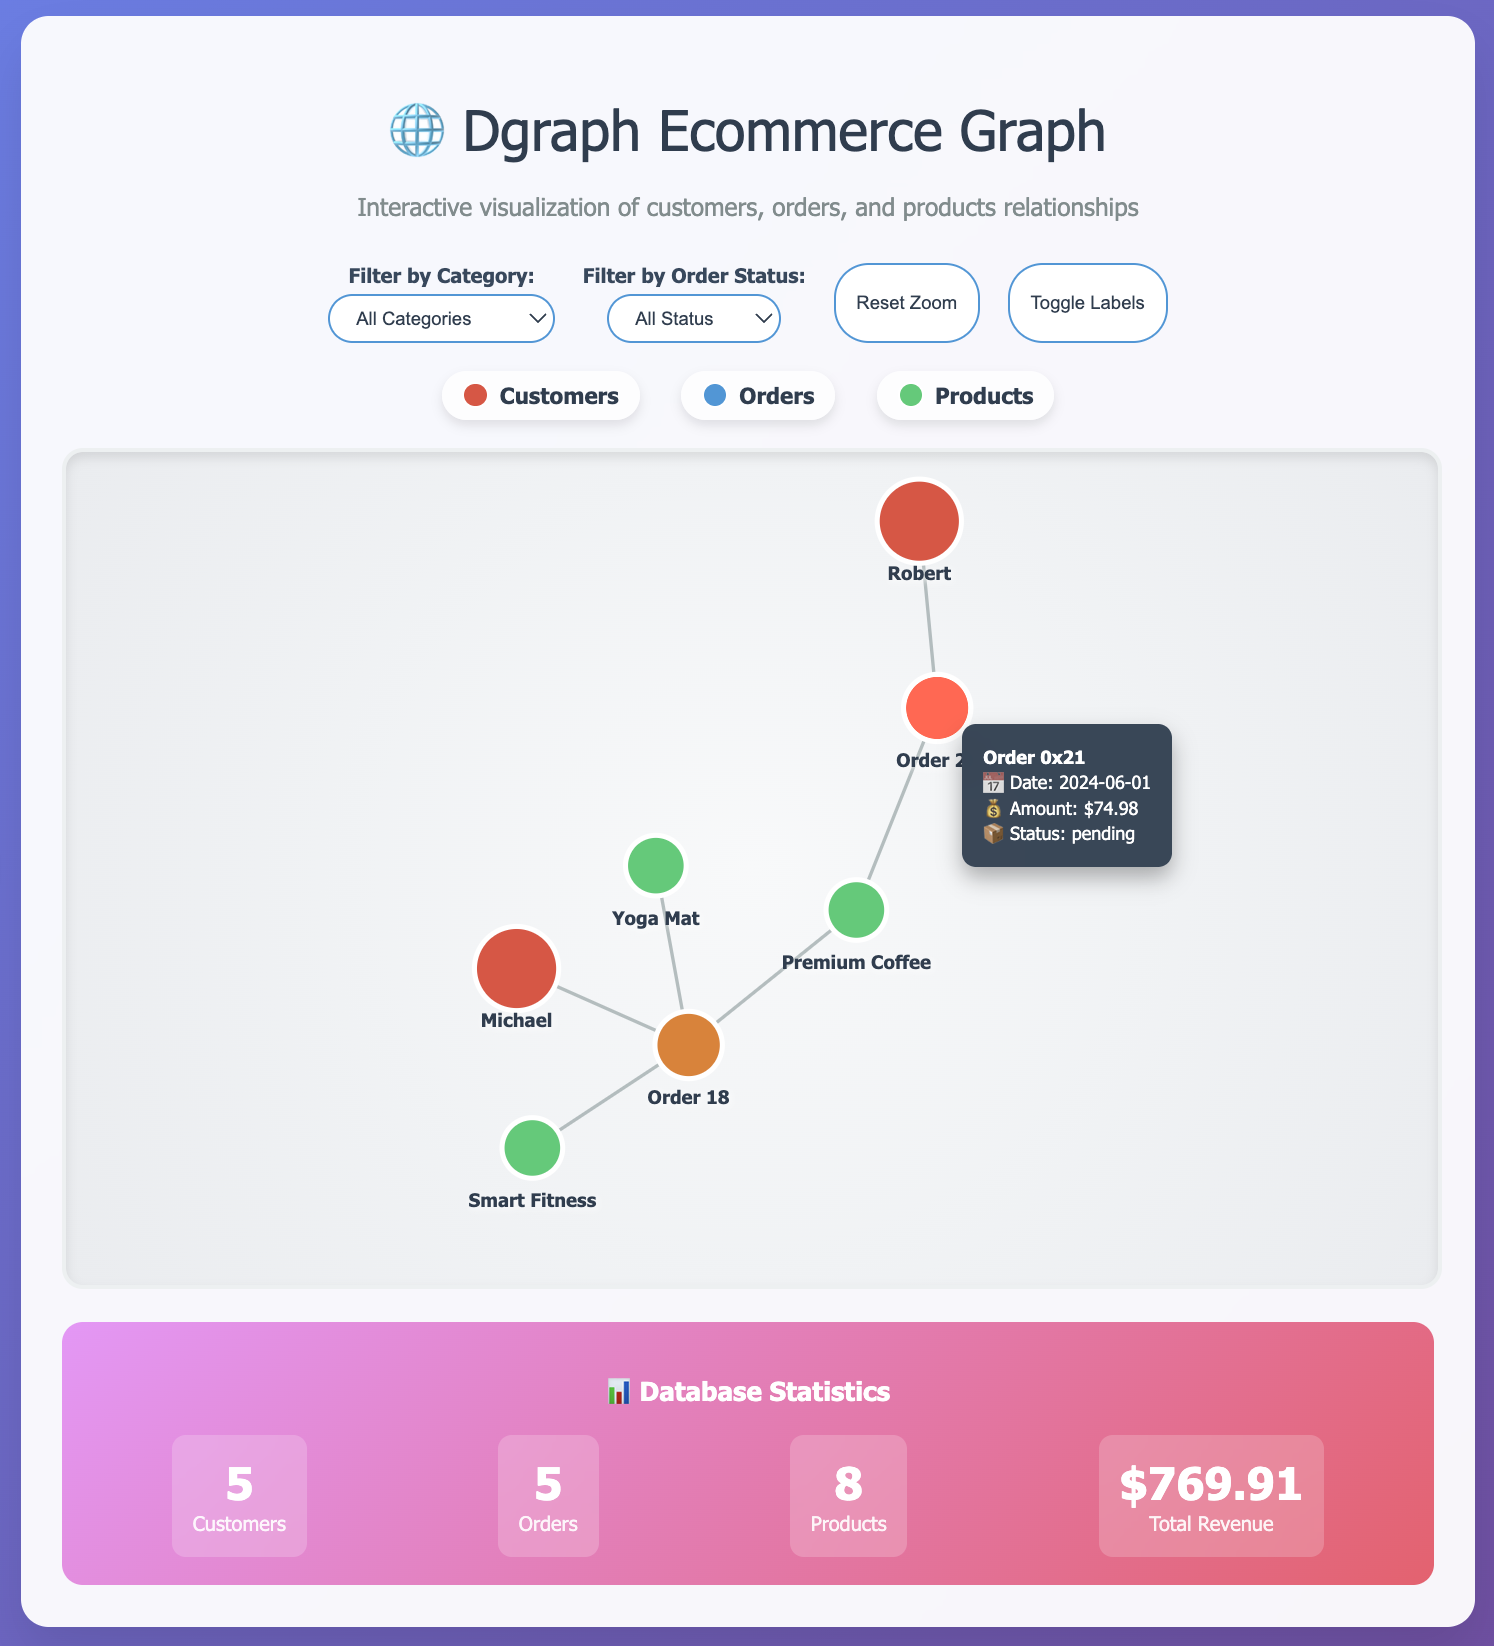
Using the Artifacts feature, Claude creates JavaScript and HTML code to render an interactive graph visualization using data queried from our graph database.
This visualization allows us to:
- See nodes representing customers, products, and orders, connected by their relationships.
- Explore the schema and zoom in on specific parts of the graph, such as a single customer’s orders or all products.
- Switch between different layout options, like force-directed (shows natural clustering), hierarchical (shows parent-child relationships), or radial (shows data in a circular pattern).
Graph visualizations can help make complex data structures easier to understand, and can also help us verify that our data is structured as expected.
Generate personalized recommendations
Graphs are powerful for generating recommendations, such as suggesting products based on purchase history and similarities to other users. Let's explore how to write graph database queries to generate personalized recommendations of products for users in our graph database based on their purchase history with the help of Claude Desktop and our graph MCP server.
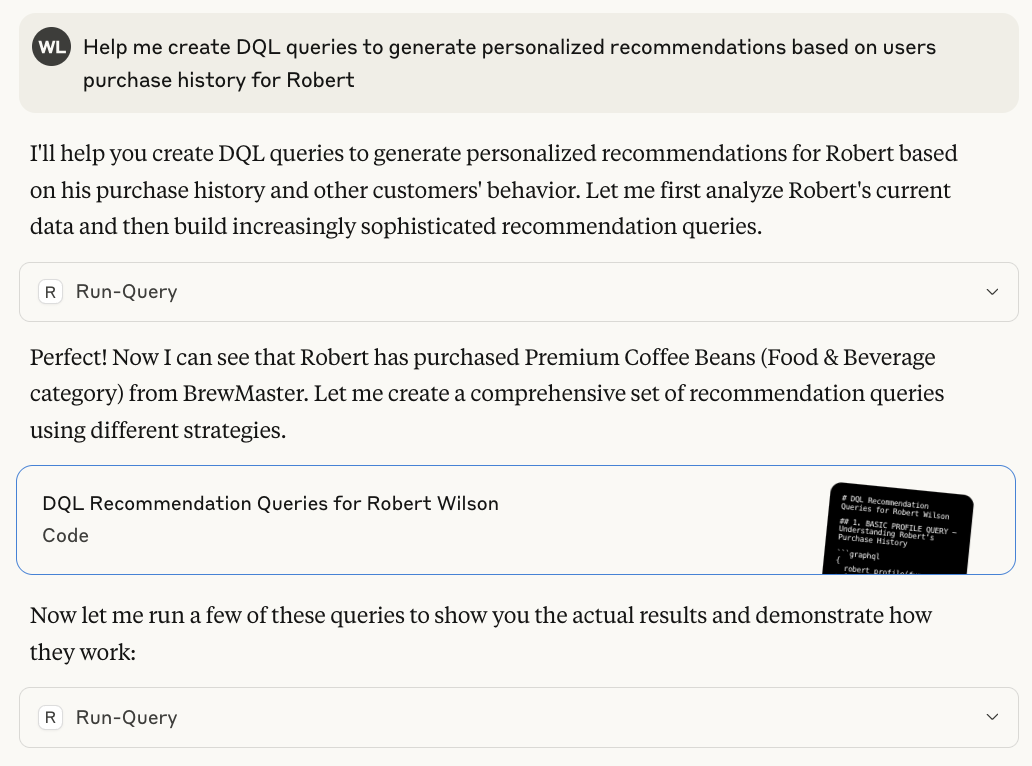
Claude suggests different recommendation strategies, such as:
- Collaborative filtering: “Users who bought this also bought…”
- Content-based recommendations: Suggesting products similar to those a user has already purchased.
- Advanced graph traversals: Finding connections between users and products multiple relationship hops.
- Demographic-based queries: Recommending products based on user attributes.
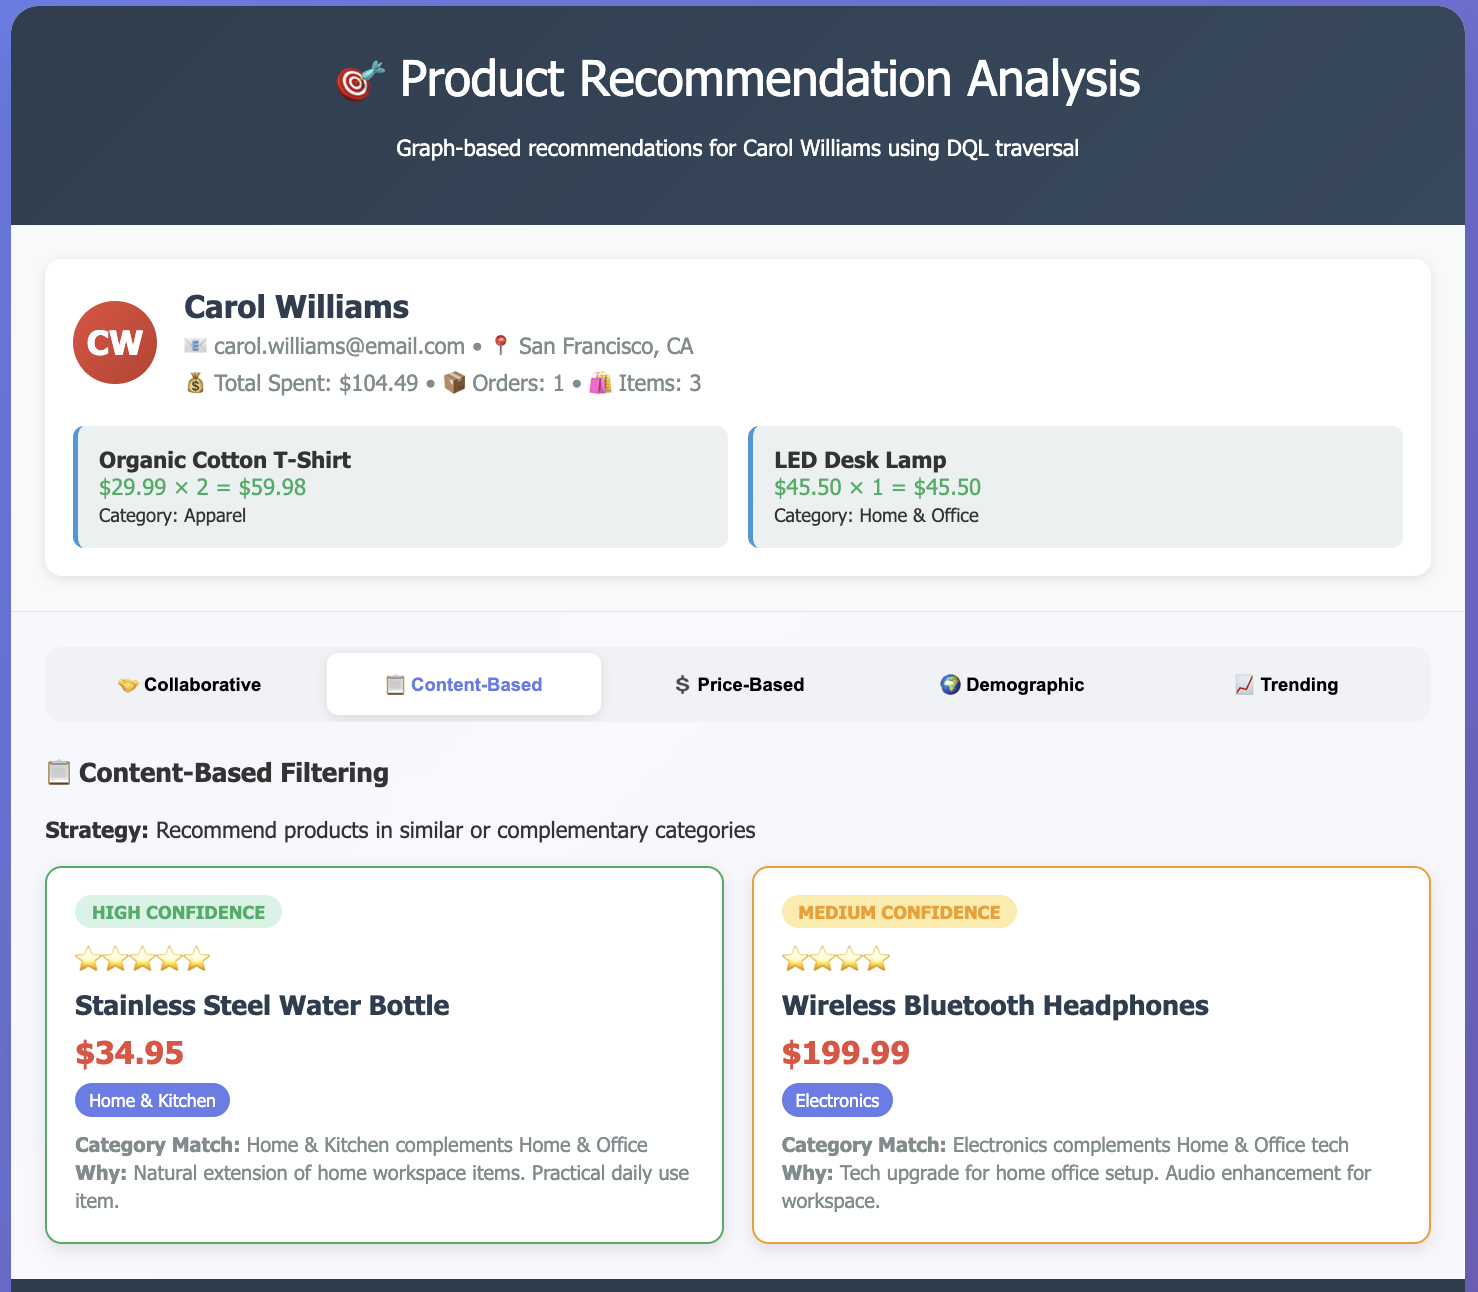
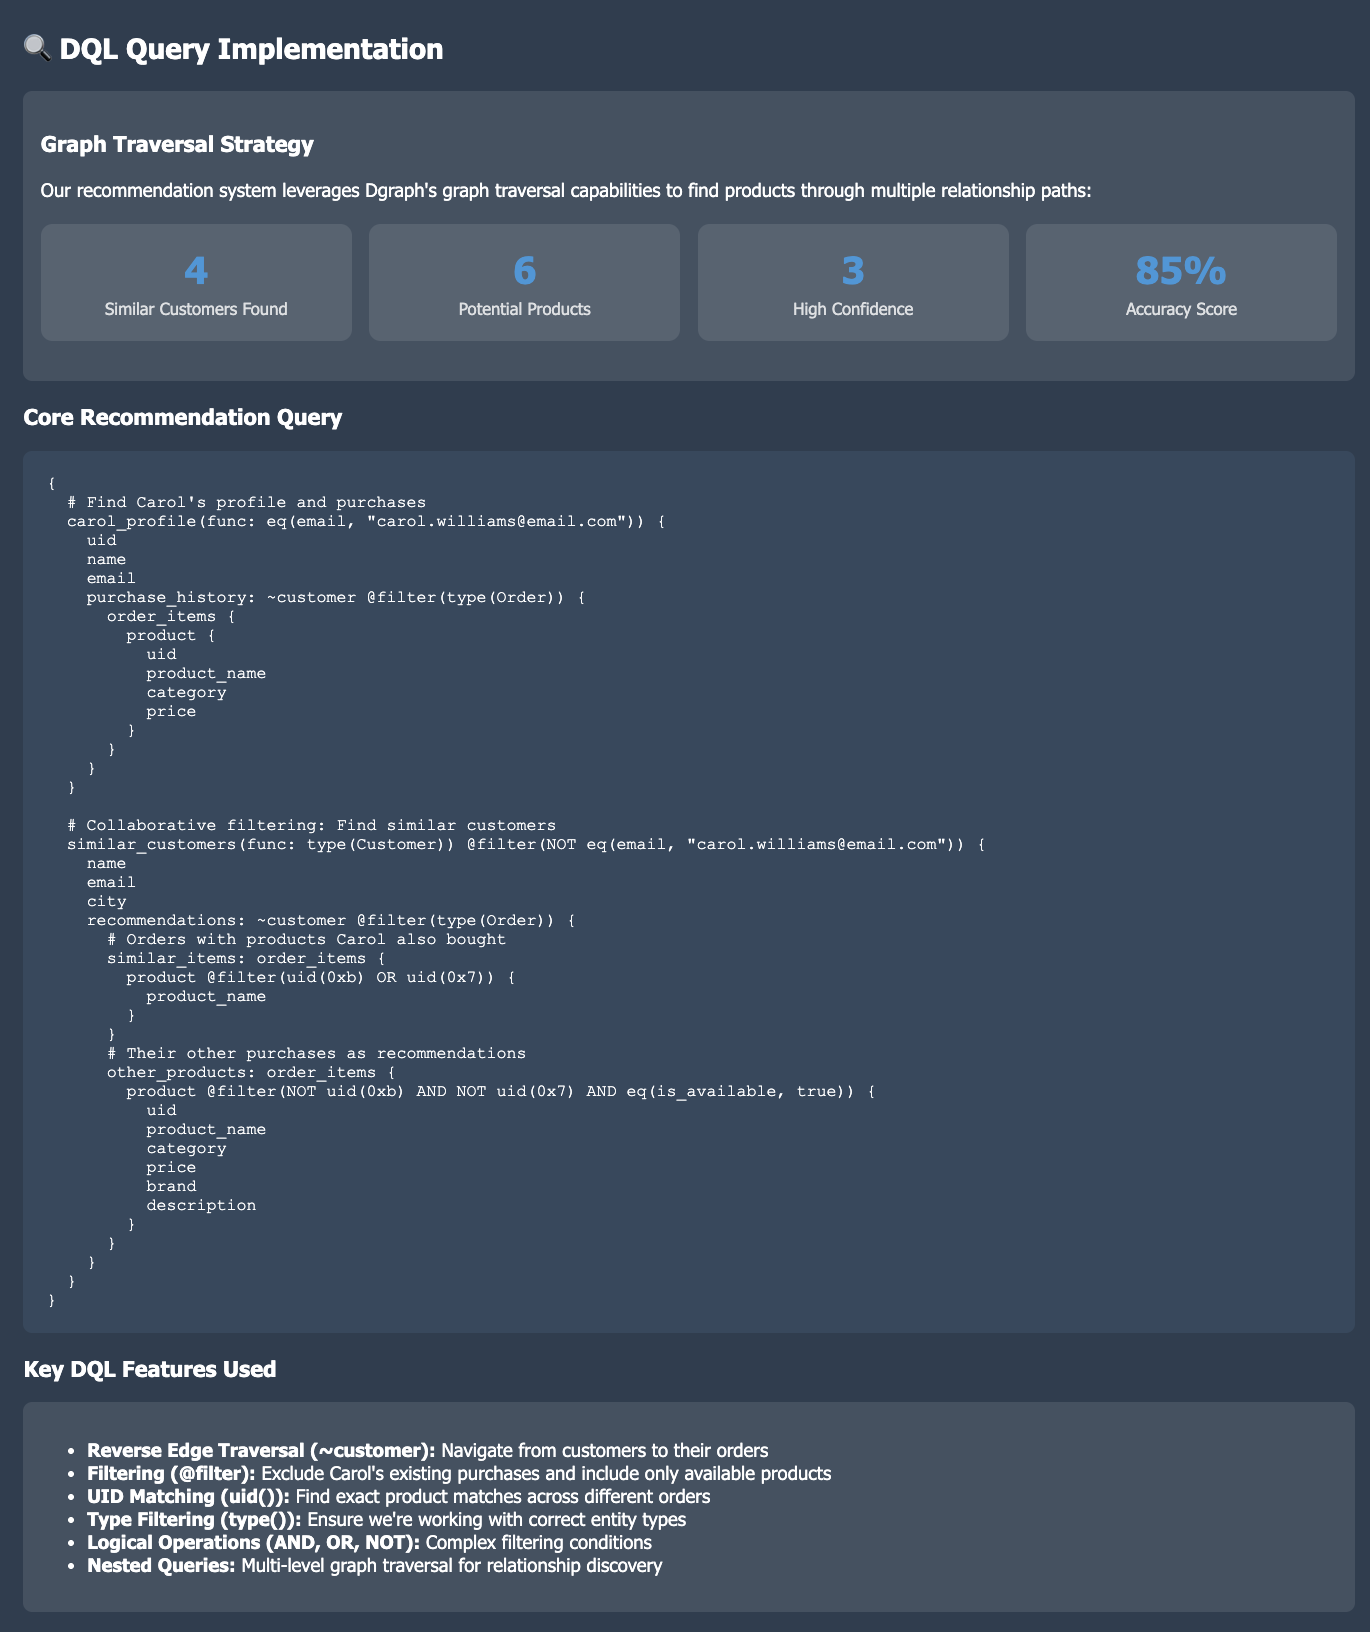
Claude iterates on these queries, refining them until they work as intended. Using the Artifacts feature, Claude generates HTML reports that display the recommendations, explain the logic behind each approach, and let us drill down into the results and the underlying queries.
Resources
MCP servers like the Dgraph and Hypermode Graph MCP server make it easy to explore and learn new developer tools interactively. Claude Desktop, combined with Hypermode, enables the process of loading, validating, and visualizing graph data to help get started with graph databases and knowledge graphs. You can generate advanced queries and recommendations with minimal manual effort, thanks to the integration between Claude and the MCP server.
Visualizations and automated validation enabled by the MCP server can help make graph databases and other developer tools accessible to beginners and experts alike.