JUNE 3 2025
Building smarter data pipelines: AI agents for automated CSV import into Dgraph
How to use AI agents to create knowledge graphs in Dgraph
A common approach for importing data into Dgraph is via the RDF N-Quad format. This approach typically requires converting your data from its original format into RDF N-Quads. When working with CSV files, this process usually meant one thing: You had to write a manual RDF template that tooling could then transform into graph triples. This process was tedious, error-prone, and required deep knowledge of both your data structure and RDF formatting.
Data engineers would spend hours analyzing CSV columns, manually identifying entities and relationships, crafting complex templates with proper syntax, and debugging import failures. A single mistake in template design could require starting over from scratch.
What if AI agents could handle this complexity automatically? In this post, we'll explore how intelligent agents are revolutionizing CSV-to-graph data pipelines, eliminating manual template creation while producing more sophisticated graph models than most humans would design.
The manual RDF template challenge
To understand how AI agents solve this problem, let's first examine the traditional manual approach using a movie dataset:
| id | title | budget | revenue | director | genre |
|---|---|---|---|---|---|
| 19995 | Avatar | 237000000 | 2787965087 | James Cameron | Science Fiction |
| 285 | Pirates of the Caribbean | 300000000 | 961000000 | Gore Verbinski | Adventure |
| 206647 | Spectre | 245000000 | 880674609 | Sam Mendes | Action |
| 603 | The Matrix | 63000000 | 171479930 | Lana Wachowski | Science Fiction |
Step 1: Manual entity analysis
First, you'd need to manually analyze each column to identify potential entities:
- Movies: Each row represents a movie (id, title, budget, revenue)
- Directors: The director column contains person names
- Genres: The genre column contains category information
Step 2: Crafting the RDF template
Next, you'd write an RDF template that maps CSV columns to graph triples. Here's what a data engineer would typically create:
# Movie entity definition
<_:Movie_[id]> <dgraph.type> "Movie" .
<_:Movie_[id]> <Movie.title> "[title]" .
<_:Movie_[id]> <Movie.budget> "[budget]" .
<_:Movie_[id]> <Movie.revenue> "[revenue]" .

# Director entity definition
<_:Director_[director]> <dgraph.type> "Director" .
<_:Director_[director]> <Director.name> "[director]" .

# Movie-Director relationship
<_:Movie_[id]> <DIRECTED_BY> <_:Director_[director]> .

# Genre entity
<_:Genre_[genre]> <dgraph.type> "Genre" .
<_:Genre_[genre]> <Genre.name> "[genre]" .
<_:Movie_[id]> <HAS_GENRE> <_:Genre_[genre]> .
Step 3: The resulting graph structure
When processed, this template would create the following graph structure:
.png)
The manual process has several critical limitations:
- Rigid Structure: Templates can't adapt to data variations or quality issues
- Schema Assumptions: Assumes perfect, consistent data formatting
- Missing Relationships: Often lacks reverse relationships for efficient traversal
- Time-Intensive: Requires manual analysis and careful syntax crafting
Enter AI agents: The intelligent solution
At Hypermode, we believe in replacing everyday repetitive tasks with lightweight AI agents. The goal isn't to build complex, heavy AI systems - it's to create focused agents that eliminate the tedious work that slows down productivity.
RDF template creation is a perfect example: it's repetitive, requires specialized knowledge, and follows predictable patterns. Instead of forcing developers to learn RDF syntax and spend hours analyzing CSV structures, we can use a Modus function to provide an elegant solution.
The context is in the headers
Here's the key insight: For a valid CSV file, all the semantic context we need is right there in the column headers. Let's examine our movie dataset:
**id,title,budget,revenue,director,genre**
19995,Avatar,237000000,2787965087,James Cameron,Science Fiction
285,Pirates of the Caribbean,300000000,961000000,Gore Verbinski,Adventure
206647,Spectre,245000000,880674609,Sam Mendes,Action
603,The Matrix,63000000,171479930,Lana Wachowski,Science Fiction
Look at what the headers tell us:
id,title,budget,revenue→ Clear Movie entity with attributesdirector→ Person names, suggesting a Director entitygenre→ Category information, indicating a Genre entity
The column naming patterns reveal the entire data model. We can see:
- Entities: Movie, Director, Genre
- Relationships: Movies are directed by Directors, Movies have Genres
- Data types: id (string), budget/revenue (integers), names (strings)
Building a Modus agent to parse this context
Instead of manually analyzing these patterns, we can create a focused Modus agent that reads the headers and generates a structural graph:
func GenerateGraph(columnNames []string) (string, error) {
    model, err := models.GetModel[openai.ChatModel]("text-generator")
    if err != nil {
        return "", err
    }

    promptText := fmt.Sprintf(`
        Analyze these CSV column headers and identify the data model:

        Headers: %s

        Based on naming patterns, identify:
        1. What entities exist (look for ID fields and grouped attributes)
        2. How entities relate to each other
        3. What attributes belong to each entity

        Return a structured graph format showing nodes and relationships.
    `, strings.Join(columnNames, ", "))

    input, err := model.CreateInput(
        openai.NewSystemMessage("You extract data models from CSV headers."),
        openai.NewUserMessage(promptText),
    )

    output, err := model.Invoke(input)
    return processGraphOutput(output.Choices[0].Message.Content), nil
}
The agent examines patterns like:
idfield → Primary key for Movie entity- Descriptive attributes →
title,budget,revenueclearly belong to Movie - Reference fields →
directorandgenresuggest separate entities - Implicit relationships → Movies are connected to Directors and Genres
From headers to visual graph
The Modus agent returns a structured representation that we can render visually:
{
  "nodes": [
    { "id": "movie", "label": "Movie", "type": "Entity" },
    { "id": "director", "label": "Director", "type": "Entity" },
    { "id": "genre", "label": "Genre", "type": "Entity" }
  ],
  "edges": [
    { "source": "movie", "target": "director", "label": "DIRECTED_BY" },
    { "source": "movie", "target": "genre", "label": "HAS_GENRE" }
  ]
}
Generating this graph structure first allows for tooling to visualize the data model - like our community solution we'll explain later. This intermediate step is crucial because it lets you make meaningful edits to the semantics and structure of the graph before RDF template generation.
Try it yourself with our prototype 👉 here.
This approach - from CSV headers to structured graph to visual review - ensures the final RDF template accurately represents your intended data model, not just a mechanical translation of column names.
Generating the RDF template with verified structure
Anyway, back to the RDF generation. Now that we have verified the graph structure and even visualized it, we can feed both this semantic structure and the original column names into another Modus function to generate the template:
func GenerateRDFTemplate(graphJson string, csvHeaders []string) (string, error) {
   var graph types.Graph
   json.Unmarshal([]byte(graphJson), &graph)

   model, _ := models.GetModel[openai.ChatModel]("text-generator")

   promptText := fmt.Sprintf(`
				Generate RDF template from graph structure and CSV headers:
				Graph: %s
				Headers: %s
				Use [column_name] placeholders and include reverse relationships.
	`, utils.GraphToTupleString(graph), strings.Join(csvHeaders, ", "))

   input, _ := model.CreateInput(
   	openai.NewSystemMessage("Generate RDF templates from graph structures."),
   	openai.NewUserMessage(promptText),
   )

   output, _ := model.Invoke(input)
   return utils.CleanRDFTemplate(output.Choices[0].Message.Content), nil
}
This Modus function GenerateRDFTemplate takes both the verified graph
structure and the original CSV headers to produce a complete RDF template that
accurately maps back to your data. This dual input is crucial - the graph
structure provides the semantic relationships while the original headers ensure
correct column mapping.
Community solution: CSV to knowledge graph
To demonstrate how AI agents can transform real-world data workflows, we built a community solution that showcases the entire pipeline from CSV upload to Dgraph import. This application serves as a practical example of how lightweight AI agents can be seamlessly integrated into a full-stack solution.
Built entirely with Modus functions powering the AI analysis, the application provides an intuitive visual interface for the complete transformation process - from initial CSV analysis to final Dgraph import.
How does it work?
Summary of the process:
- Upload your CSV: Simply drag and drop your CSV files into the browser
- AI analyzes your data: An AI model examines your column names to automatically identify entities and relationships
- Visual graph preview: See and interact with the proposed knowledge graph structure
- Generate RDF: Convert your CSV data to the RDF format Dgraph requires
- One-click import: Connect to your Dgraph instance and import with a single click
Upload your CSV
The process begins with a simple drag-and-drop interface where users can upload their CSV files directly in the browser. The application immediately parses the file and displays a preview of the data structure, showing the column headers that will be analyzed by our AI agents.

AI analyzes your data
Once uploaded, the GenerateGraph Modus function examines the CSV column
headers to automatically identify potential entities and relationships. The AI
recognises patterns in naming conventions and data structures to build a
comprehensive understanding of your data model.

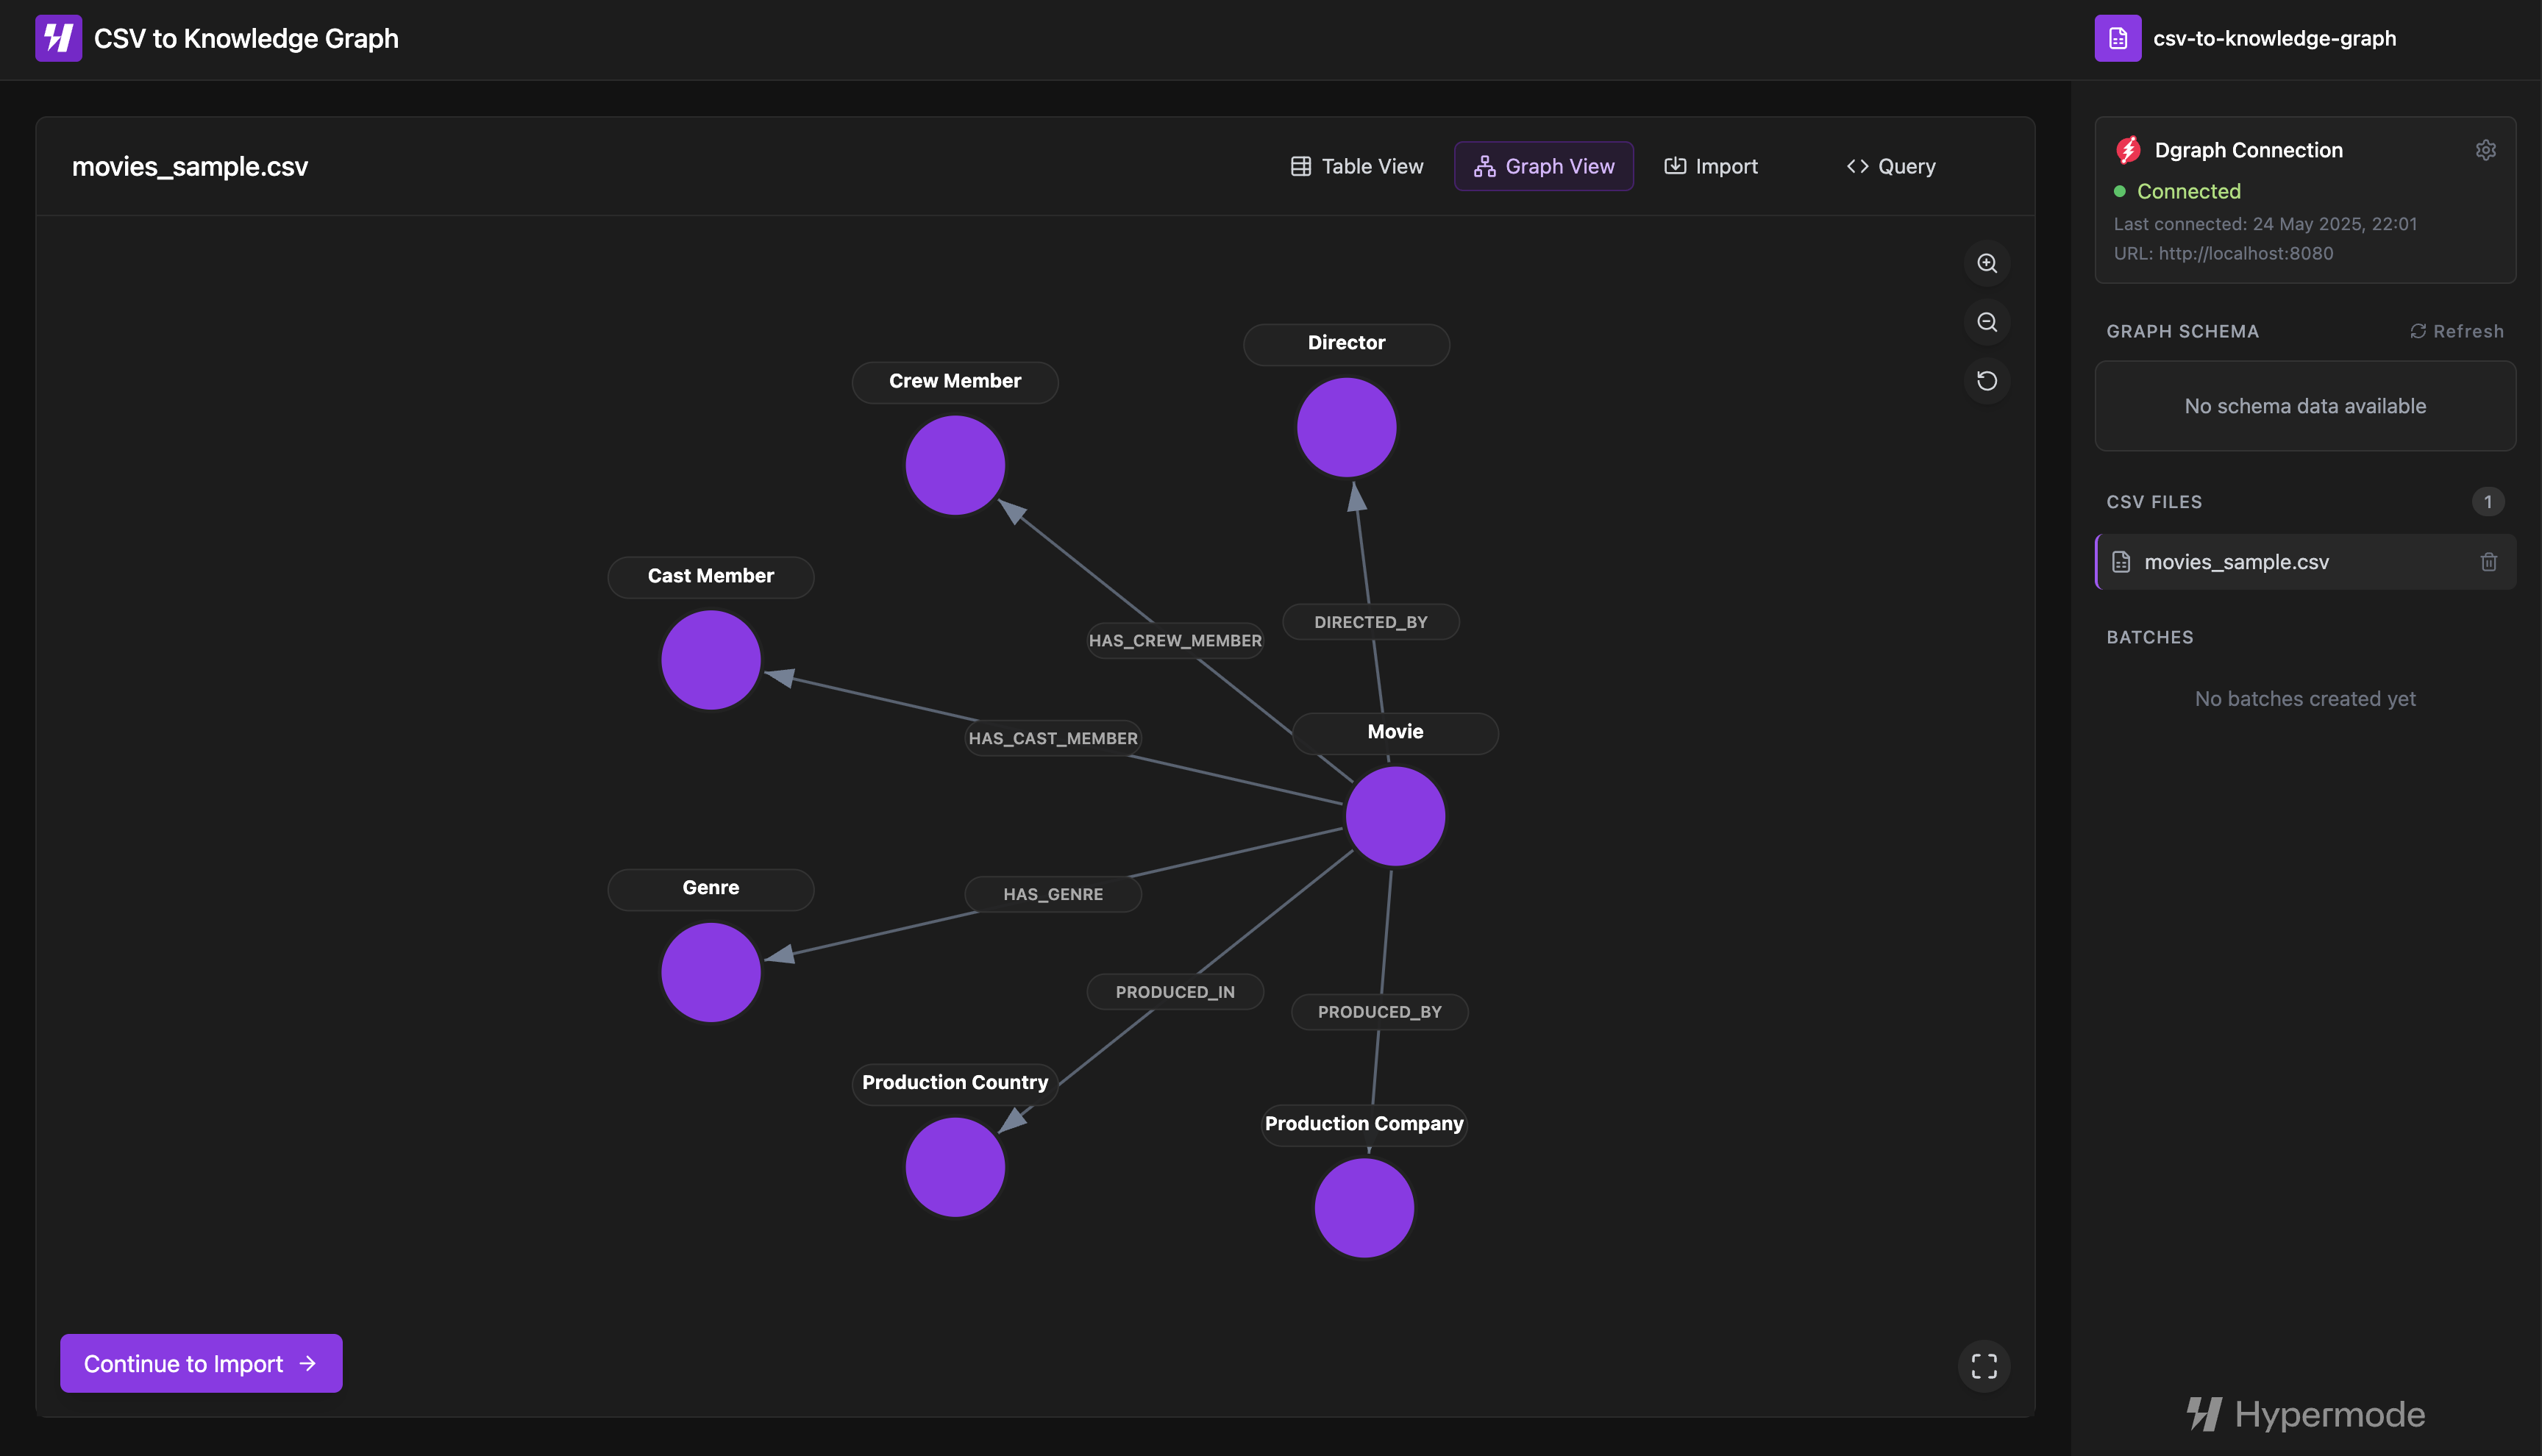
Visual graph preview
The analyzed structure is rendered as an interactive graph visualization, allowing users to see exactly how their data will be modeled. Users can zoom, pan, and reposition nodes to better understand the relationships before proceeding.
1-click import
For users who want the simplest experience, the 1-click import automatically
generates the RDF template using the GenerateRDFTemplate function and imports
the data directly to your Dgraph instance. The application handles schema setup,
relationship configuration, and provides detailed statistics on the import
process.
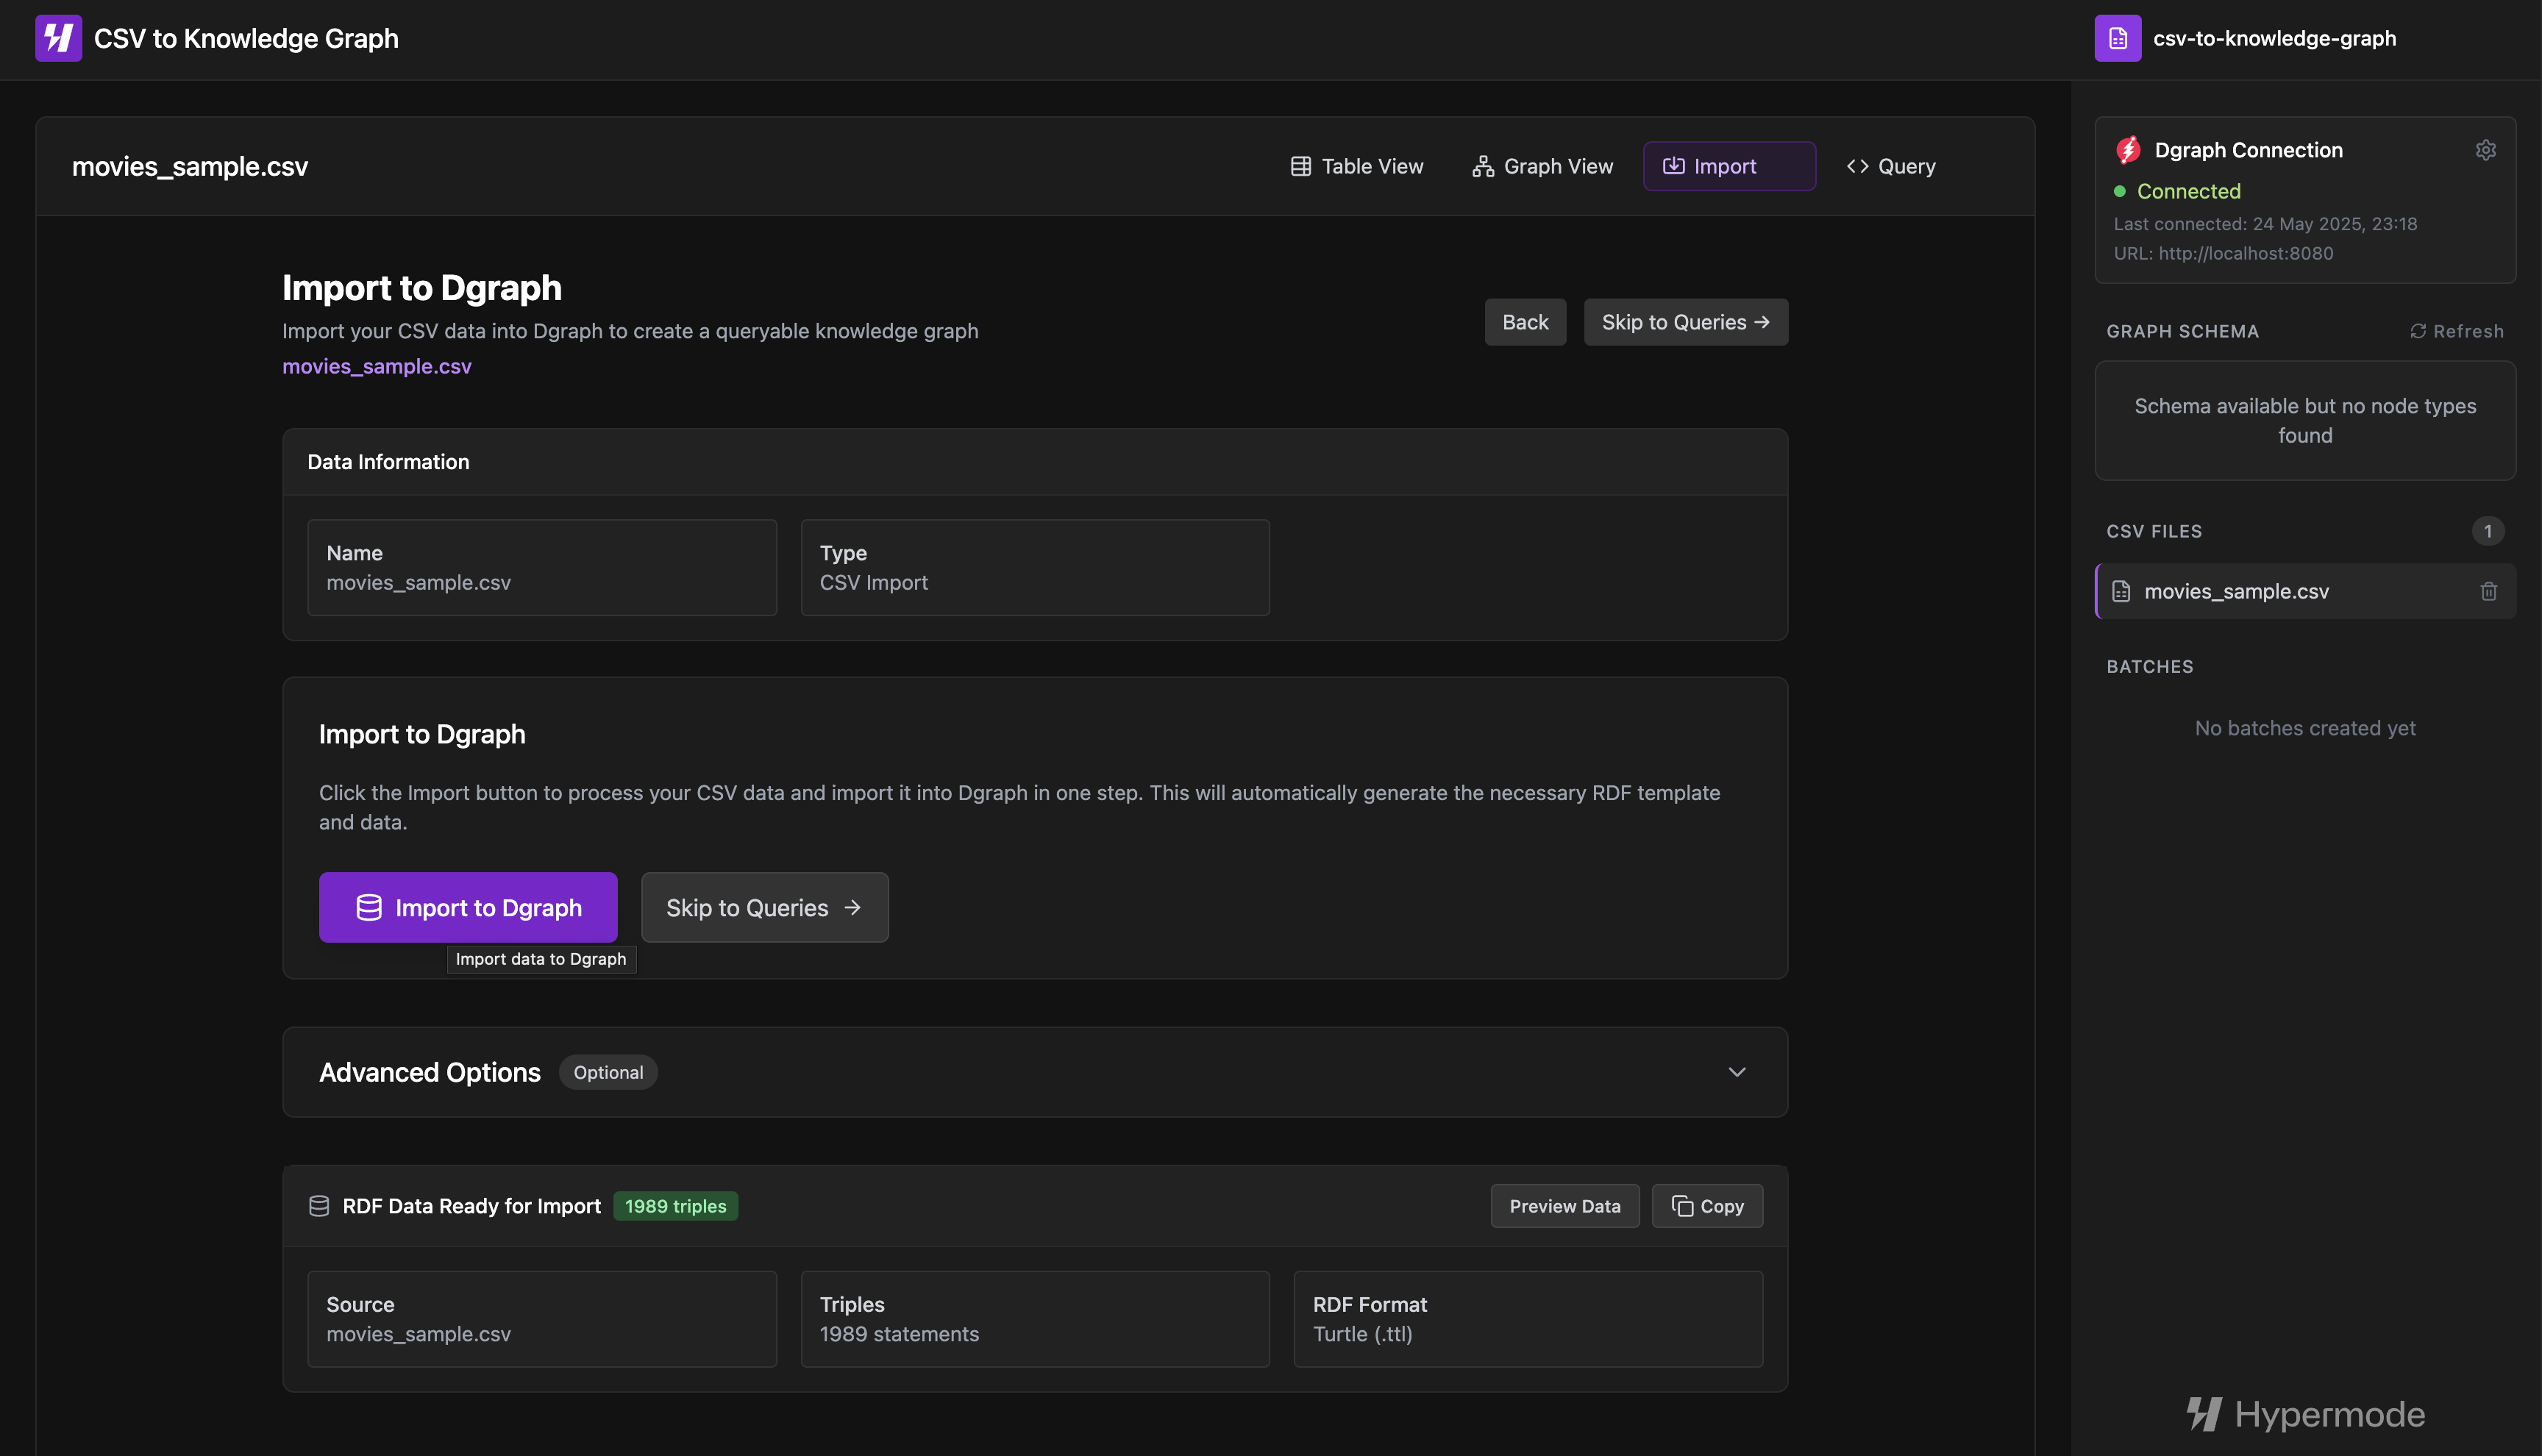
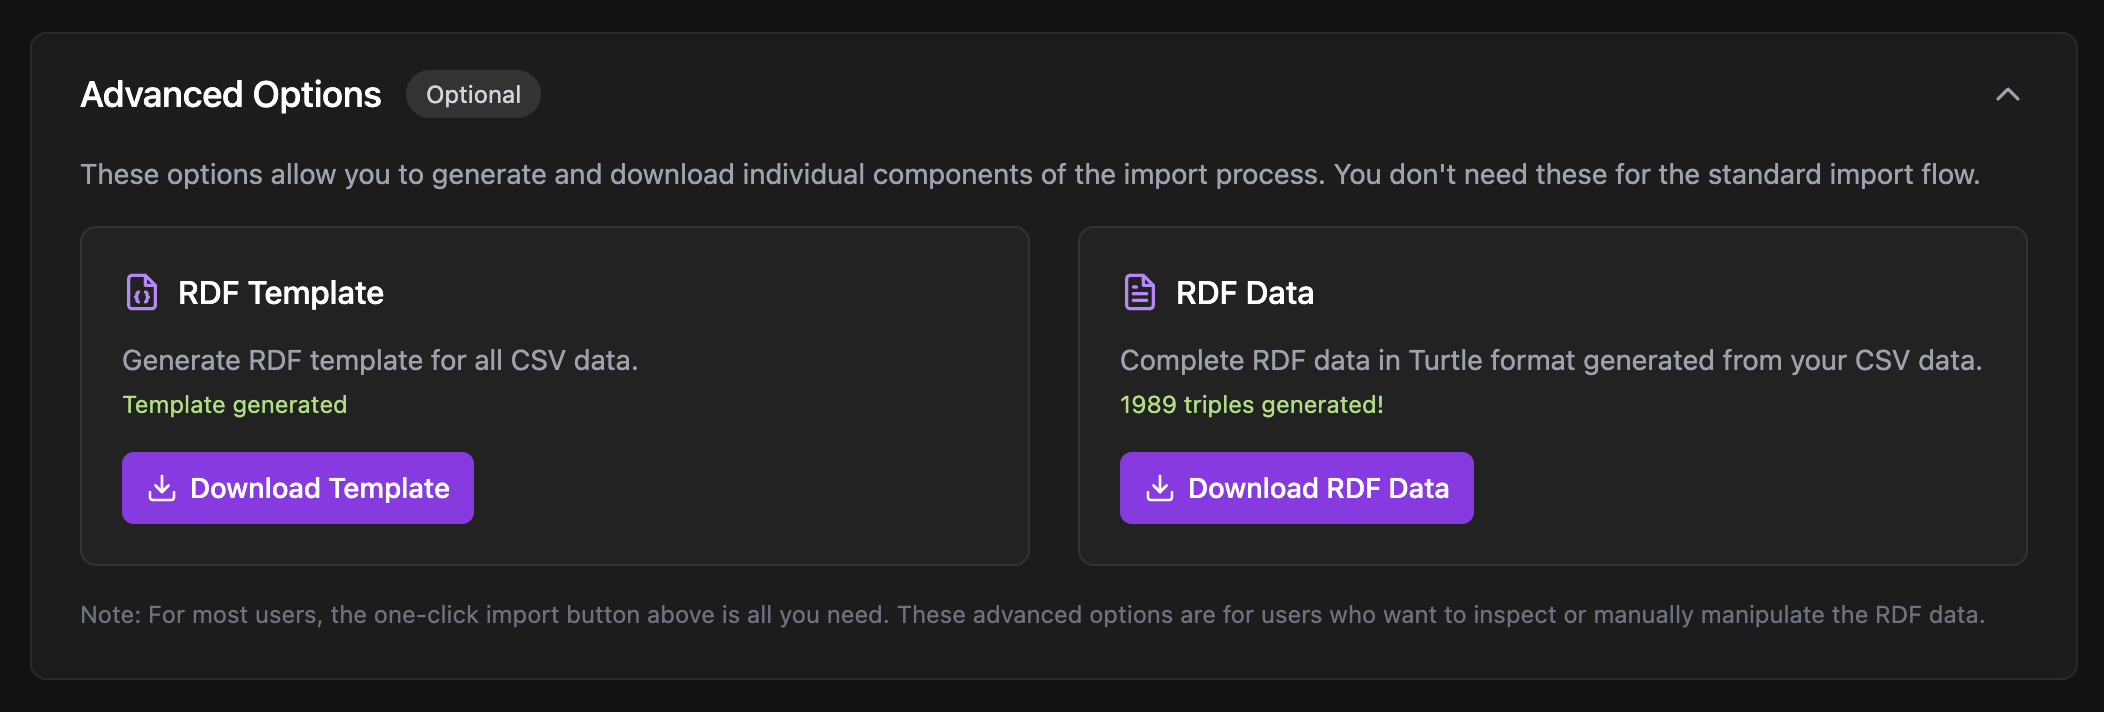
Advanced options
For users who want more control, advanced options allow you to inspect the generated RDF template and converted data before import. You can review the exact triples that will be created, modify the template if needed, and monitor the conversion progress in real-time.
AI-generated queries
Once your data is imported, you can leverage another Modus function as we do in the application to generate tailored DQL queries based on your schema. The AI analyzes your entity types, relationships, and predicates to create meaningful queries that demonstrate graph traversal patterns and data retrieval operations specific to your imported dataset.

Summary
It's been a journey. We've learned how to manually transform CSV files into graphs, experienced just how tedious and cryptic the process is, and then discovered that something as simple as using AI agents to generate graph structures can revolutionize this manual tedious work.
Main takeaway
You can use Hypermode to build small, simple but sophisticated agents in their nature to perform the simplest of tasks to save time and reduce manual work. These focused Modus functions don't need to solve everything - they just need to eliminate specific pain points that slow down productivity.
Building lightweight AI agents with Hypermode transforms tedious manual work into automated workflows. The goal isn't to create complex, heavy AI systems - it's to build focused agents that eliminate the repetitive tasks that eat up your day. RDF template generation is just one example of how simple Modus functions can save hours of specialized work.
Check out the code for this project on GitHub.