AUGUST 22 2025
Agentic Workflows For Graph RAG
How agentic workflows can enhance Graph-based RAG
In a recent episode of Hypermode Live with Amy Hodler, founder of GraphGeeks, we dive into how agentic AI systems can enhance Graph-based retrieval-augmented generation by intelligently navigating knowledge graphs, orchestrating complex retrieval patterns, and dynamically adapting search strategies based on query context—transforming how we think about both graph construction and intelligent information retrieval.
Agentic Workflows For Graph RAG
Based on a conversation between Will from Hypermode and Amy Hodler from Graph Geeks
Retrieval Augmented Generation (RAG) has become a cornerstone of modern AI applications, but as the technology matures, we're hitting some limitations. Traditional RAG systems struggle with semantic understanding, ambiguous queries, and complex multi-step reasoning. This is where Graph RAG enters the picture—and when combined with agentic workflows, it opens up powerful new possibilities for building production-ready AI systems.
The Current State of RAG: Hitting a Plateau
Traditional RAG systems excel at augmenting Large Language Models (LLMs) with external or updated data, making responses more accurate and contextually appropriate. However, several limitations are becoming apparent:
- Semantic gaps: LLMs struggle to understand actual meaning, leading to misalignment between queries and answers
- Ambiguous results: When data contradicts itself or lacks clarity, traditional RAG systems falter
- Long-tail events: Rare occurrences that don't happen often are difficult to handle effectively
- Context window limitations: Restricting the amount of information that can be processed at once
These challenges have created what researchers call the "RAG plateau"—a point where incremental improvements to traditional approaches yield diminishing returns.
Why Graph RAG Makes Sense
Graphs naturally address many of RAG's current limitations by providing structured relationships and semantic context. Here's what graphs bring to the table:
Structured relationships
Unlike traditional databases where relationships are implicit, graphs make connections first-class citizens. This enables more nuanced understanding of how entities relate to each other.
Multi-hop reasoning
Graphs excel at traversing relationships across multiple documents or data points, enabling complex reasoning that requires connecting disparate pieces of information.
Contextual understanding
The relationship-rich structure of graphs provides natural context that helps bridge the semantic gap between user queries and relevant information.
Hybrid search capabilities
Graph RAG systems can combine exact matches (structural queries) with approximate matches (vector similarity) to provide more comprehensive results.
The agentic advantage
Graph RAG becomes even more powerful when implemented as part of agentic workflows. Rather than treating graph queries as a single step in the process, agentic approaches create dynamic, iterative interactions between the AI agent and the graph database.
Key agentic patterns in Graph RAG
Query Routing: Agents can intelligently route queries to appropriate tools or workflows, whether that's text-to-Cypher generation, template-based queries with parameters, or hybrid approaches.
Error handling and recovery: When a graph query returns empty results or encounters errors, agents can automatically fall back to alternative strategies like fuzzy search or query reformulation.
Iterative refinement: Agents can use graph results to inform subsequent queries, creating a back-and-forth dialogue that progressively narrows down to the most relevant information.
Result re-ranking: Graph topology information (like PageRank scores) can be used by agents to intelligently prioritize and rank results.
Building production-ready Graph RAG: A systematic approach
Moving from proof-of-concept to production requires a systematic approach that balances automation with human oversight.
1. Schema design: The foundation
The quality of your graph directly impacts the quality of your Graph RAG results. Here are seven key principles for schema design:
Model the domain, not the data: Design your schema around the real-world relationships in your problem space, not just what's convenient based on your existing data structure.
Relationships matter: Unlike relational databases, graphs elevate relationships to first-class citizens. Explicitly define relationship types and directionality.
Balance nodes and properties: Avoid the extremes of making everything a node or stuffing too many properties into single nodes. Find the right balance for query performance.
Consider granularity: Denormalization can improve performance, but excessive denormalization reduces flexibility and makes maintenance harder.
Enforce consistency: Use constraints for uniqueness, existence requirements, and relationship cardinality where appropriate.
Optimize for queries: Design your schema with your expected query patterns in mind, including proper indexing strategy.
Start simple, iterate: Nobody gets their schema right on the first try. Plan for evolution and refinement over time.
2. Leveraging LLMs for graph construction
LLMs can significantly accelerate graph construction, but human oversight remains crucial. LLMs excel at:
- Suggesting schema definitions
- Extracting entities and relationships from text
- Inferring attributes and properties
- Resolving some types of ambiguity
However, domain expertise is still essential for handling nuances, resolving complex ambiguities, and ensuring the schema serves your specific use case.
3. The role of structured output tools
Tools like BAML (Boundary ML) are becoming increasingly important in Graph RAG workflows. BAML provides:
- Type Safety: Enforces structured outputs from LLMs
- Expressiveness: Works well with both graphs and LLMs
- Reliability: Reduces the unpredictability often associated with LLM outputs
When extracting structured data from unstructured text for graph construction, providing detailed descriptors and aliases in your prompts can significantly improve extraction quality.
A practical example: Medical records Graph RAG
Let's look at a concrete implementation using patient medical records data from the BAML Dgraph Patient Graph Example. This example shows how to build a Graph RAG system that combines BAML for structured extraction, Dgraph for graph storage, and agentic workflows powered by Model Context Protocol (MCP) for intelligent query processing.
The data model
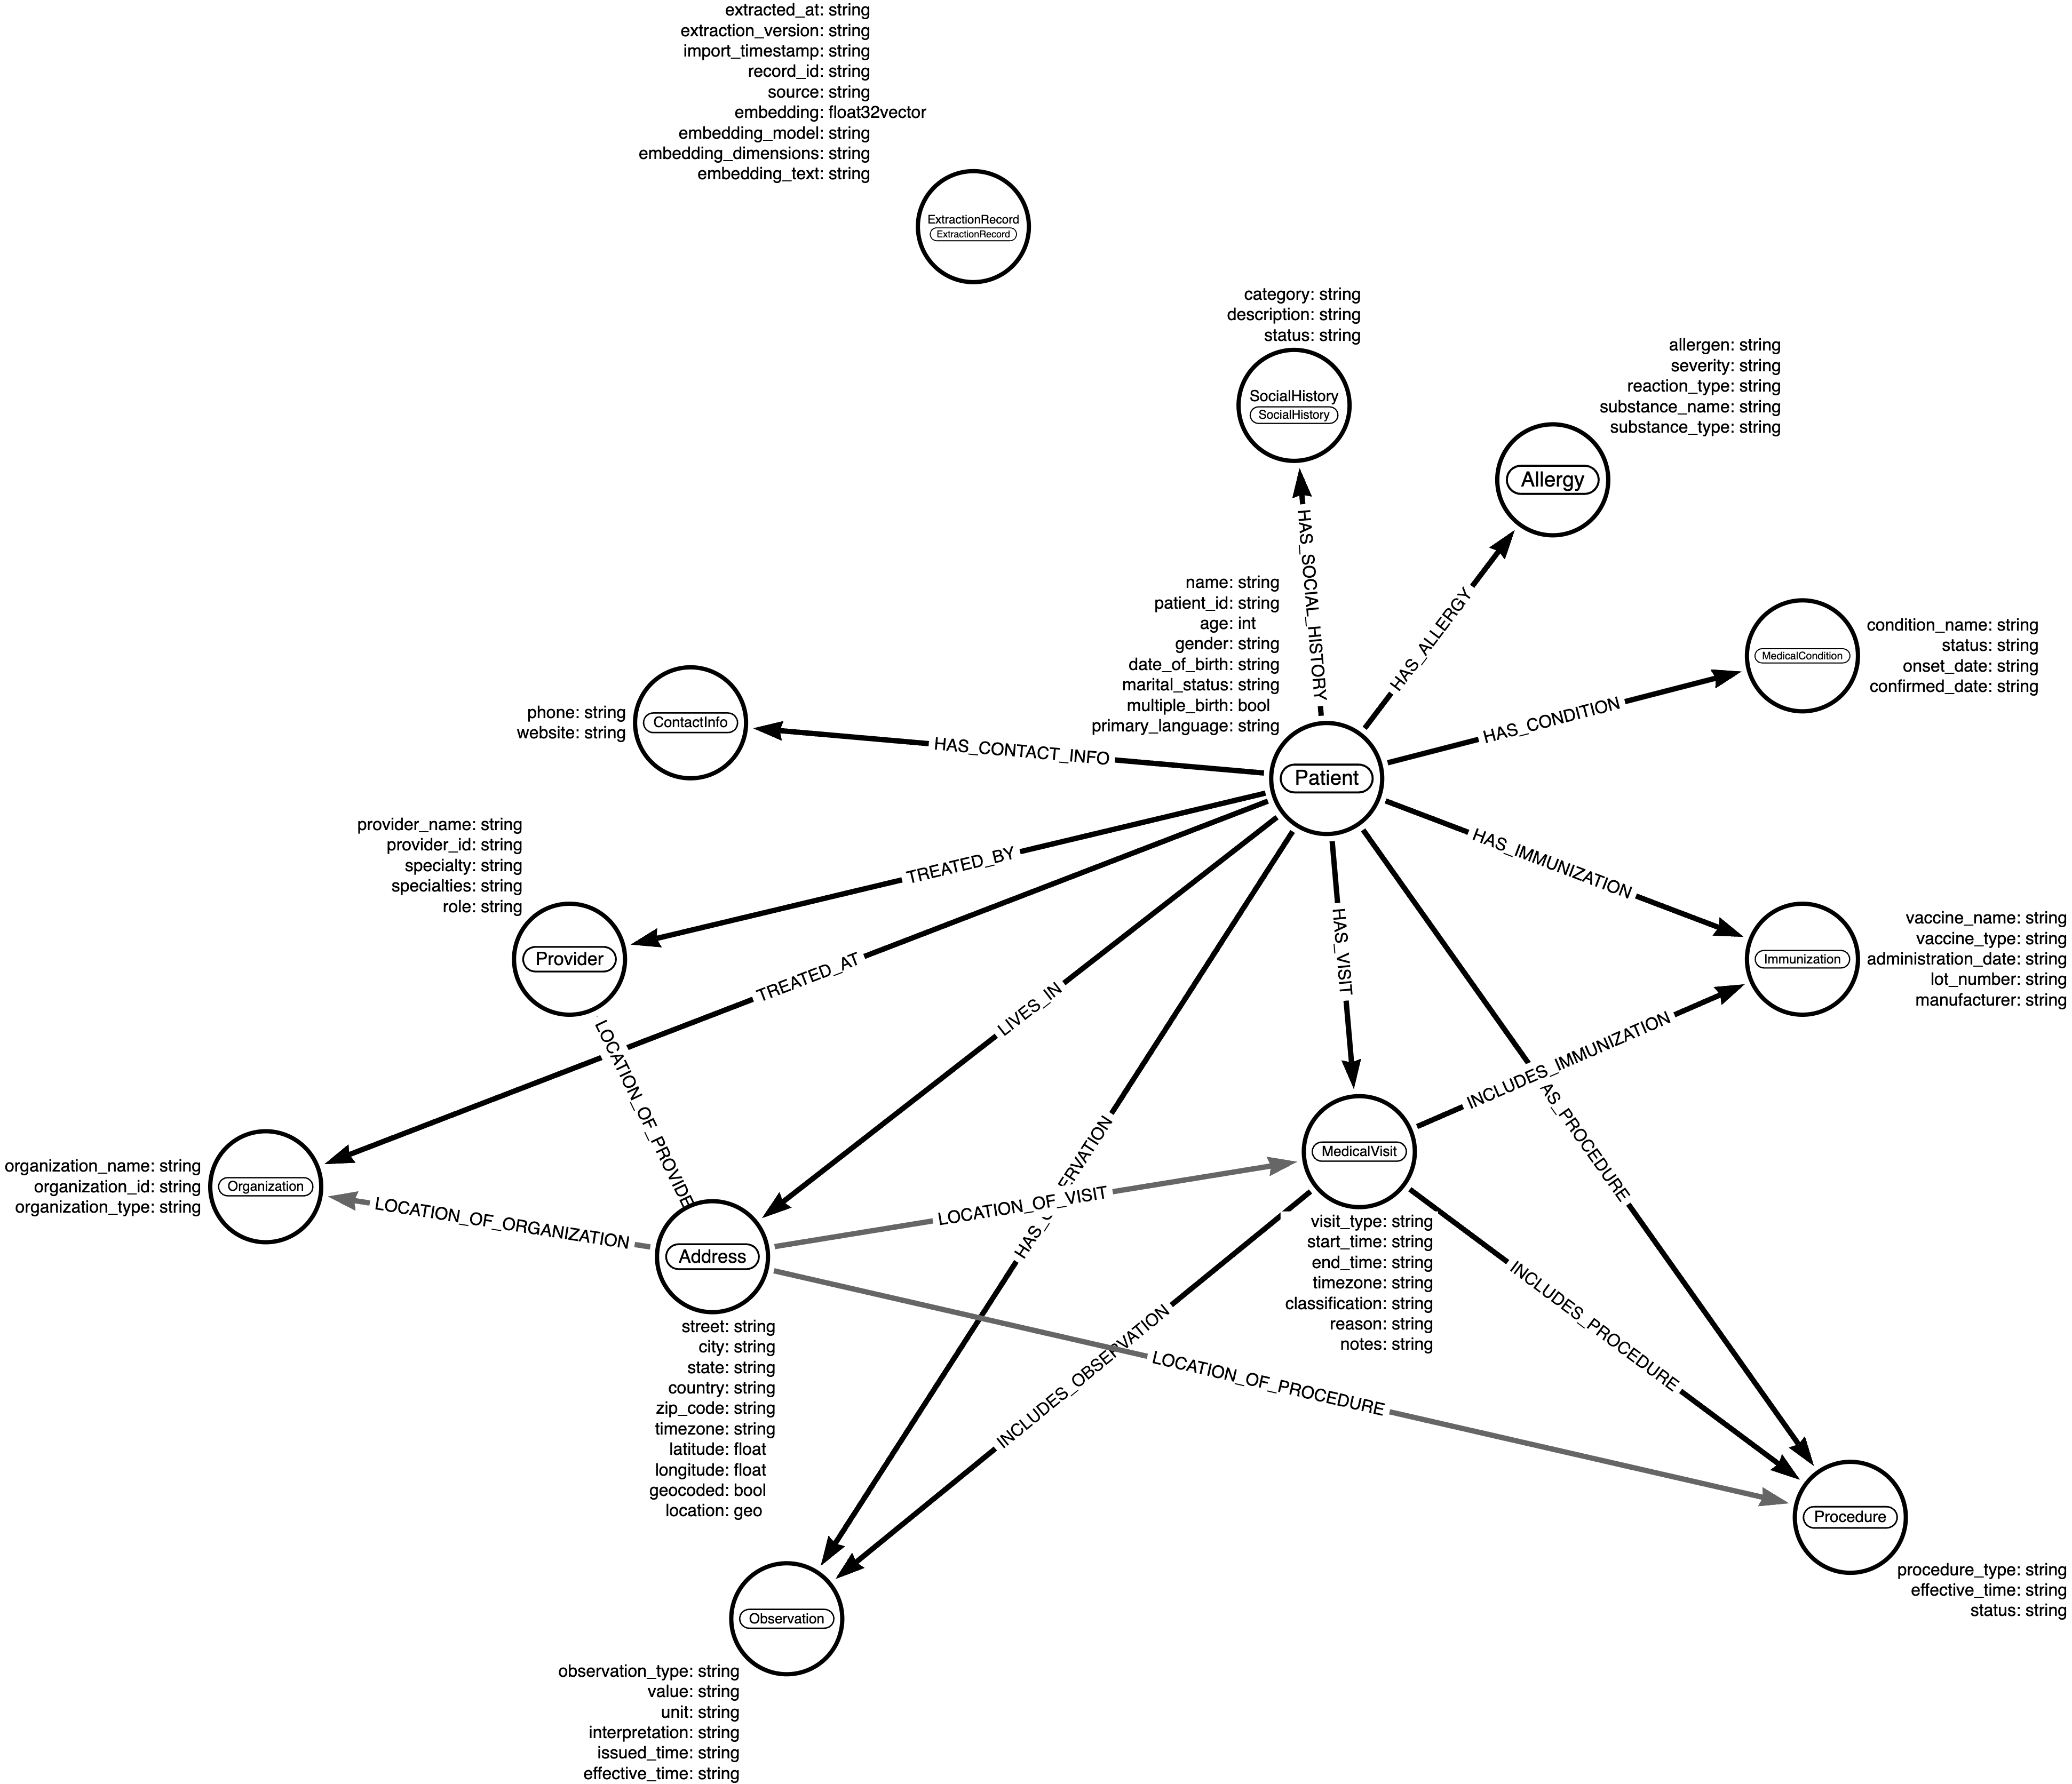
The system models complex healthcare relationships including:
- Patients: Demographics, medical history, and personal information
- Medical Visits: Visit types, reasons, status, and clinical notes
- Allergies: Allergens, severity, reactions, and clinical status
- Immunizations: Vaccine details, administration, and clinical notes
- Conditions: Medical conditions, severity, and clinical status
- Providers: Medical staff information, specialties, and roles
- Addresses: Geocoded locations with spatial indexing capabilities
BAML schema for medical entity extraction
The system uses BAML to define structured extraction schemas that ensure reliable entity extraction from medical text:
# Example BAML schema for medical entity extraction
class Patient:
    name: str
    age: int
    date_of_birth: str
    gender: str
    contact_info: ContactInfo
    medical_history: List[MedicalEvent]
    allergies: List[Allergy]
    immunizations: List[Immunization]

class Allergy:
    allergen: str
    severity: AllergySeverity
    reaction: str
    onset_date: str
    status: AllergyStatus

class MedicalVisit:
    visit_type: VisitType
    reason: str
    provider: str
    date: str
    notes: str
    status: VisitStatus
Dgraph schema with advanced indexing
The Dgraph schema leverages multiple indexing strategies for optimal query performance to support graph retrieval queries, including full-text, vector embeddings, and geospatial indexes. These indexes provide entry points into the graph traversal during a graph retrieval query.
# Core patient schema with comprehensive indexing
<name>: string @index(term, fulltext) .
<age>: int @index(int) .
<date_of_birth>: datetime @index(date) .
<gender>: string @index(exact) .

# Medical visit schema with relationship indexing
<visit_type>: string @index(term) .
<reason>: string @index(fulltext) .
<visit_date>: datetime @index(date) .
<status>: string @index(exact) .

# Allergy schema with severity and status indexing
<allergen>: string @index(term, fulltext) .
<severity>: string @index(exact) .
<reaction>: string @index(fulltext) .
<status>: string @index(exact) .

# Geospatial indexing for address locations
<latitude>: float @index(float) .
<longitude>: float @index(float) .
<location>: geo @index(geo) .

# Vector embeddings for semantic search
<embedding>: vector @index(vector) .
<embedding_model>: string .
<embedding_dimensions>: int .
Hybrid architecture: Vector + Graph + structured search
By combining vector search, graph traversal, and structured search, the system can handle complex queries and provide more accurate results.
Vector Search: Uses Ollama-generated embeddings for fuzzy matching and semantic understanding. For example, finding "seafood allergies" when the database contains "shellfish" and "fish" allergies.
Graph Traversal: Enables complex relationship queries like "Find patients with severe allergies who haven't had visits in over 2 years."
Structured Search: Provides exact matches for specific entity lookups and filtering.
Sample medical queries and results
The system handles complex medical queries that demonstrate the power of Graph RAG:
Patient safety queries:
# Find patients with multiple severe allergies and their most recent visit
{
  high_risk_patients(func: type(Patient)) @filter(ge(allergies, 2)) {
    name
    age
    allergies @filter(eq(severity, "severe")) {
      allergen
      severity
      reaction
    }
    ~has_visit @facets(orderdesc: visit_date, first: 1) {
      visit_type
      reason
      visit_date
    }
  }
}
Geospatial healthcare queries:
# Find patients within 50km of a specific location
{
  nearby_patients(func: type(Address)) @filter(ge(location, "POINT(-71.0589 42.3601)", 50)) {
    uid
    street
    city
    state
    ~location_of_patient {
      name
      age
      allergies {
        allergen
        severity
      }
    }
  }
}
MCP And Agentic Chat Workflows
One of the most powerful aspects of the BAML Dgraph Patient Graph Example is how it demonstrates the integration of Model Context Protocol (MCP) with Claude Desktop to create a natural language interface for complex graph analysis. This approach transforms how healthcare professionals and researchers can interact with patient data, making sophisticated graph queries accessible through conversational AI.
What is MCP and Why It Matters
Model Context Protocol (MCP) is an open standard that enables AI assistants like Claude to seamlessly integrate with external data sources and tools. In the context of our patient graph, MCP allows Claude to:
- Directly query the Dgraph database without needing to understand DQL syntax
- Execute complex graph traversals through natural language requests
- Access real-time patient data for immediate analysis and insights
- Perform multi-step reasoning across different types of medical information
Setting Up Dgraph MCP with Claude Desktop
The integration process is straightforward and opens up powerful analytical capabilities:
1. Verify your Dgraph MCP server: Each Dgraph instance serves an MCP endpoint. See the Dgraph MCP documentation to find the appropriate endpoint for your Dgraph instance.
2. Add MCP to Claude Desktop: Users can add the Dgraph MCP server to Claude Desktop through the settings, providing Claude with direct access to the patient graph database. See the Claude Desktop documentation for more details.
3. Authenticate and Connect: Once configured, Claude can authenticate with the Dgraph instance and begin querying patient data through natural language.
Natural Language Allergy Analysis in Action
With the MCP integration, healthcare professionals can now ask complex questions about patient allergies in plain English, and Claude will automatically translate these into sophisticated graph queries.
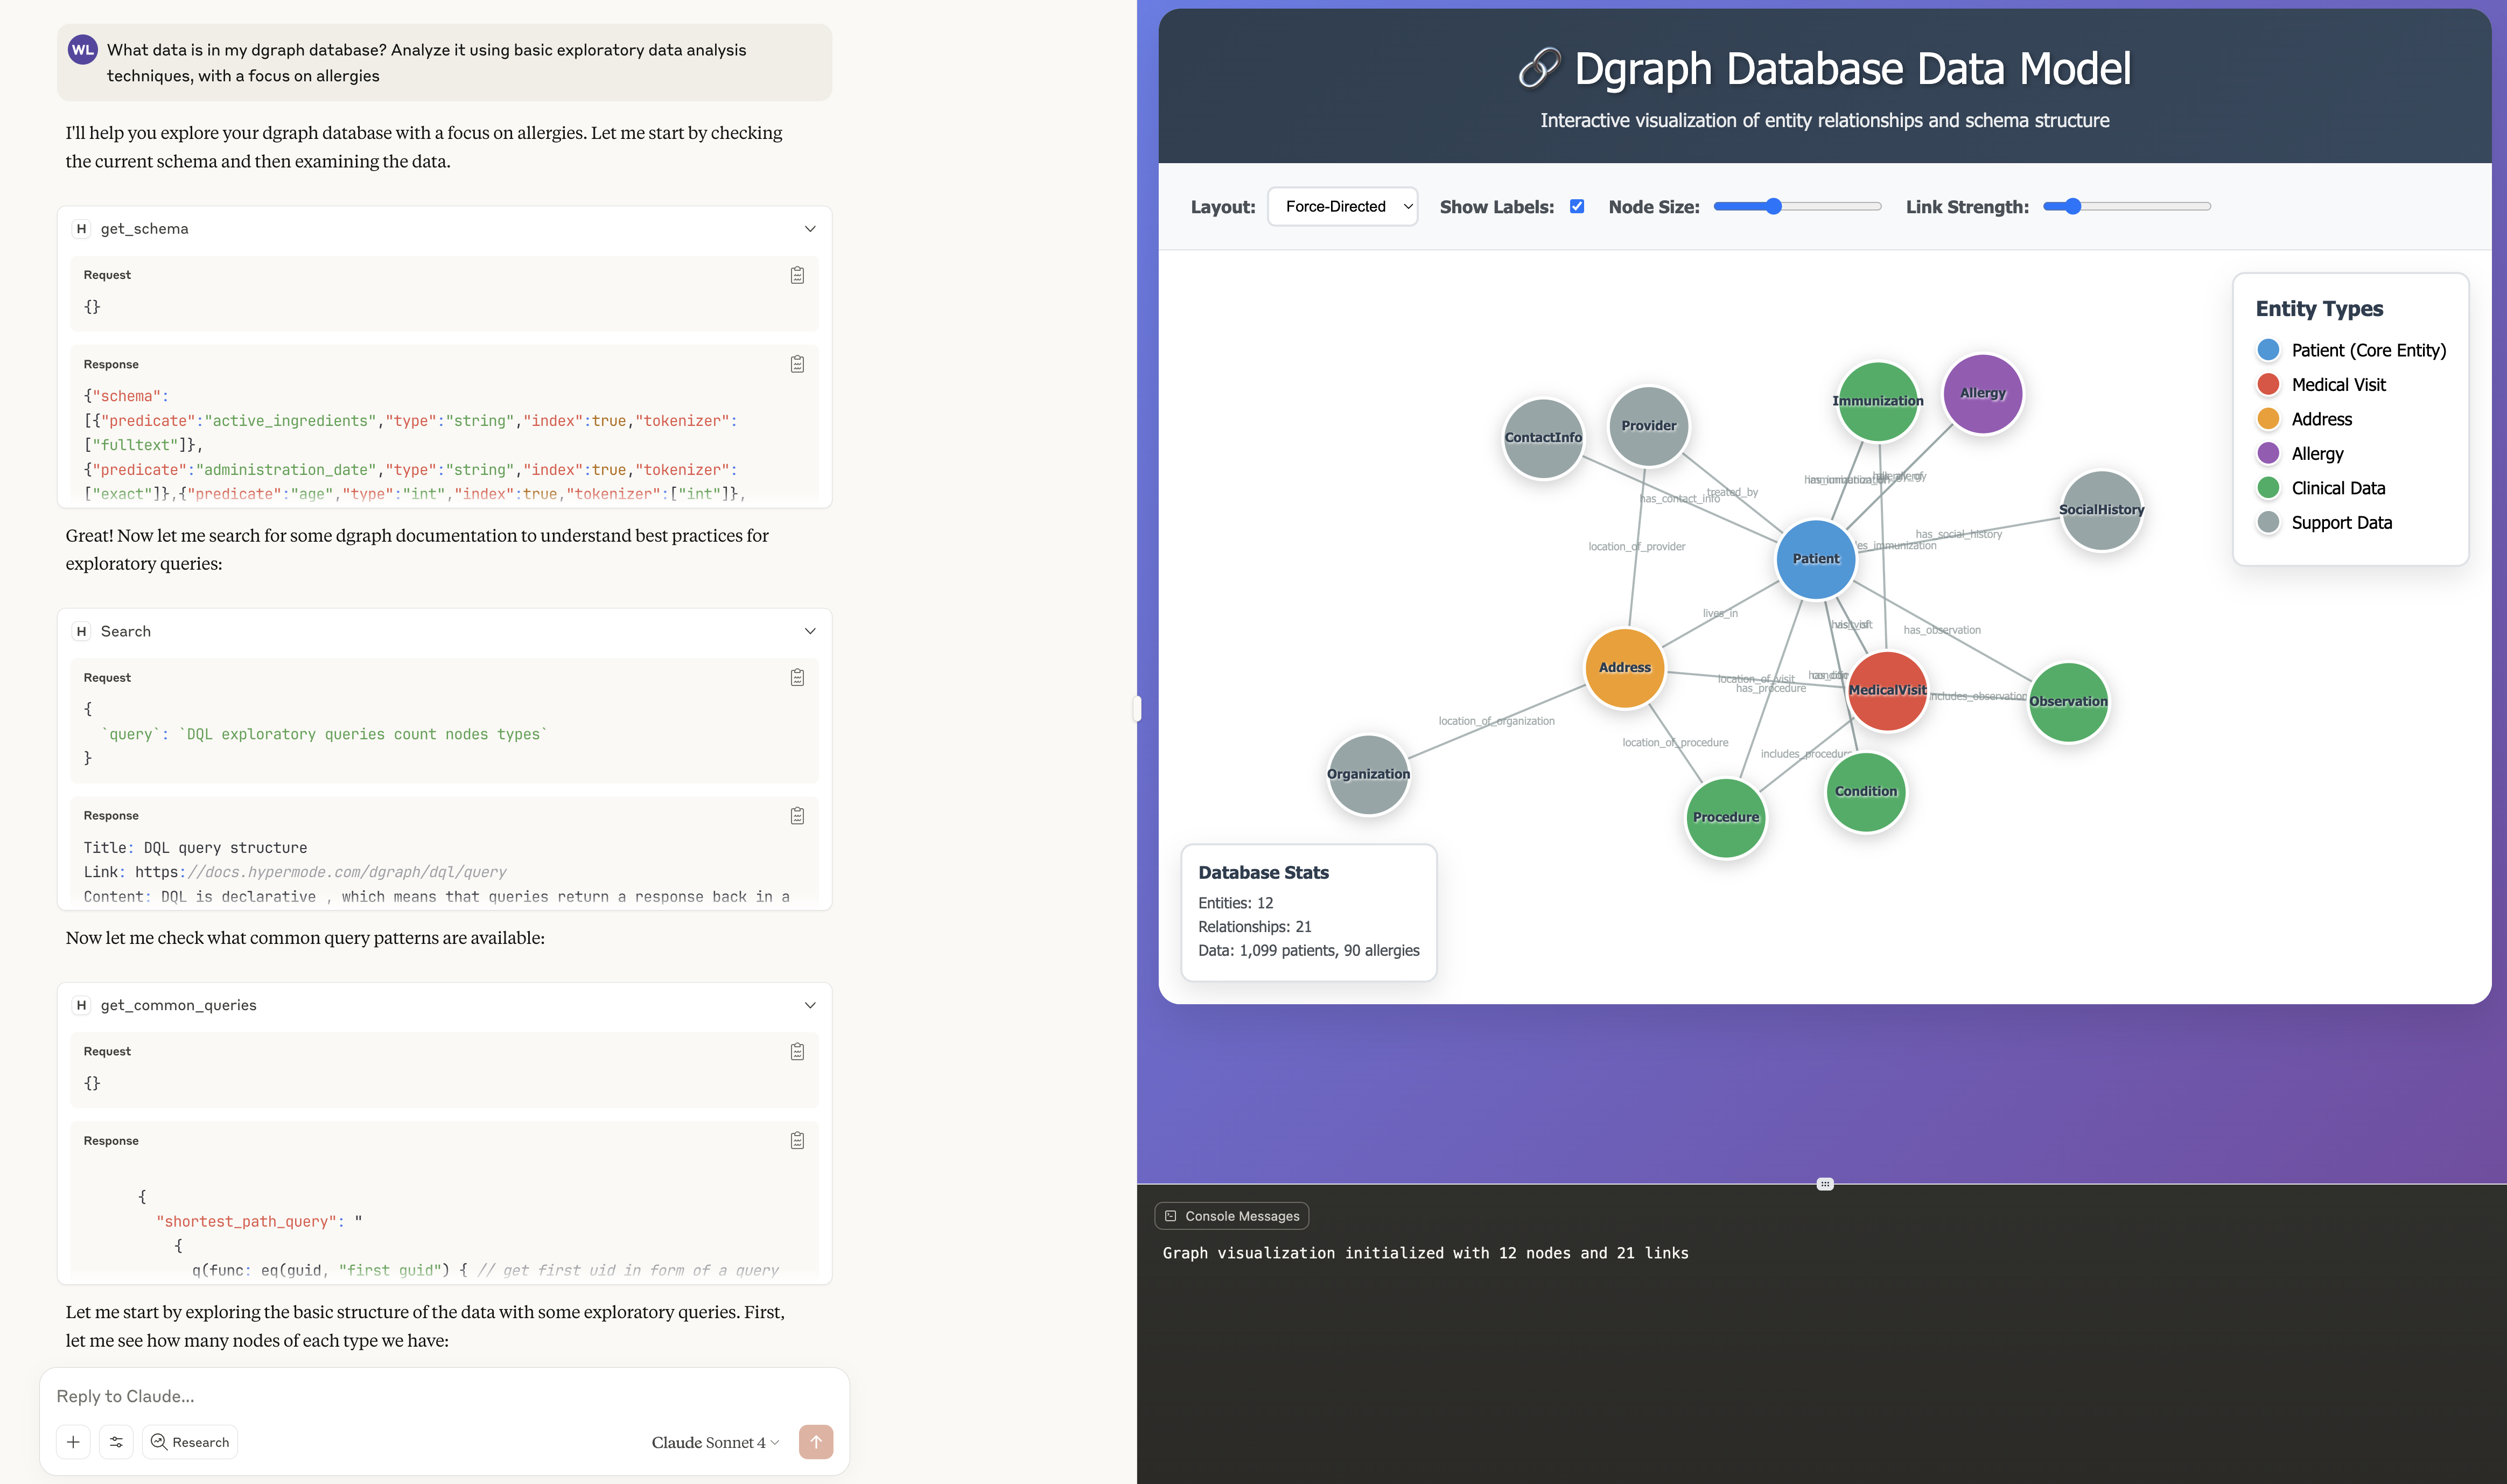
Here are some real-world examples:
"Show me all patients with severe peanut allergies who haven't had a visit in the last 6 months"
Claude automatically translates this into a multi-step analysis:
- Entity Recognition: Identifies "peanut" as an allergen, "severe" as severity level, and "6 months" as a time constraint
- Graph Traversal: Navigates the patient → allergy → visit relationships
- Temporal Filtering: Applies date-based logic to identify overdue patients
- Risk Assessment: Flags these patients as potentially needing follow-up care
"What's the correlation between patient age and the number of allergies they have?"
Claude performs a comprehensive analysis:
- Data Aggregation: Groups patients by age brackets
- Relationship Counting: Counts allergies per patient
- Statistical Analysis: Calculates correlation coefficients and trends
- Visualization Suggestions: Recommends charts to display the findings
"Find patients with shellfish allergies who live within 25 miles of downtown and haven't been immunized for flu this season"
This complex query demonstrates the power of combining multiple data dimensions:
- Allergy Filtering: Identifies shellfish allergy patients
- Geospatial Analysis: Uses coordinate data to find patients within the specified radius
- Immunization Status: Checks flu vaccine records for the current season
- Risk Prioritization: Ranks patients by multiple risk factors
How Tool Use Works Behind the Scenes
When Claude receives a natural language query, the MCP integration enables a sophisticated tool-use workflow:
Query Understanding: Claude analyzes the user's intent and identifies the relevant data dimensions (allergies, patients, visits, locations, etc.).
Schema Inspection: Claude can inspect the Dgraph schema to understand available predicates, relationships, and indexing options.
Query Generation: Based on the user's request, Claude generates appropriate DQL queries that leverage the database's indexing and relationship structure.
Result Processing: Claude receives the raw query results and transforms them into human-readable insights, often suggesting additional analysis or follow-up questions.
Contextual Enhancement: Claude can combine results from multiple queries to provide comprehensive answers, such as correlating allergy patterns with demographic information or care history.
Real-World Healthcare Applications
This natural language interface to the patient graph opens up numerous practical applications:
Clinical Decision Support: Physicians can quickly assess patient risk factors by asking questions like "What other patients with similar allergy profiles have experienced adverse reactions to this medication?"
Population Health Management: Healthcare administrators can identify at-risk populations: "Show me all patients with multiple severe allergies who haven't had preventive care visits this year."
Research and Analytics: Researchers can explore complex relationships: "Analyze the relationship between environmental factors (based on patient addresses) and allergy prevalence across different age groups."
Quality Assurance: Compliance teams can monitor care gaps: "Find patients with documented allergies who received medications that could trigger allergic reactions."
The Future of Conversational Graph Analysis
The MCP integration represents a significant step toward democratizing access to complex graph databases. Healthcare professionals no longer need to learn GraphQL syntax or understand database schemas to extract valuable insights from patient data.
This approach also enables iterative exploration, where users can ask follow-up questions based on initial results, creating a natural dialogue that mimics how humans naturally explore complex problems. For example, after learning about allergy patterns, a user might ask "Why do we see this pattern?" or "What interventions have been most effective for similar patients?"
The combination of Claude's reasoning capabilities with the rich relationship data in the patient graph creates a powerful tool for medical research, clinical care, and healthcare administration—all accessible through natural conversation rather than complex technical queries.
Multimodal Graph RAG: The frontier
An emerging area of Graph RAG involves incorporating non-textual data like images and audio. For example:
- Spatial relationships in images can be modeled as graph connections
- Fleet formations in maritime images reveal tactical patterns through spatial topology
- Social dynamics in photographs can be inferred from body language and positioning
While still nascent, multimodal Graph RAG represents an exciting frontier that could dramatically expand the scope of knowledge graphs.
Production Considerations
Measurement and Evaluation
One of the biggest challenges in Graph RAG is the lack of standardized benchmarks. Without proper measurement, it's difficult to:
- Assess the quality of your implementation
- Identify areas for improvement
- Avoid "graph RAG disappointment" from poor-quality graphs
Ongoing Maintenance
Graph RAG systems require continuous attention:
- Schema evolution as your data and requirements change
- Data quality monitoring to catch drift and inconsistencies
- Performance optimization as your graph grows
Architectural Decisions
Consider whether to use:
- Specialized databases for different functions (vector, graph, traditional)
- Multi-purpose databases that combine capabilities
- Hybrid approaches that balance simplicity with specialized performance
The Sliding Scale of Agency
It's important to note that "agentic" exists on a spectrum. Anthropic distinguishes between:
- Workflows: LLMs and tools orchestrated through predefined paths
- Fully Agentic: Systems where LLMs dynamically direct their own processes with complete autonomy
For production Graph RAG systems, starting with more controlled workflows allows you to:
- Evaluate each stage independently
- Establish baselines and behavior patterns
- Gradually increase autonomy as the system proves reliable
Looking Ahead: Graph as Memory
An exciting development in the graph space is the concept of using graphs as memory systems for AI agents. This goes beyond Graph RAG to create persistent, evolving knowledge representations that agents can both read from and write to over time.
This represents a natural evolution from static retrieval systems to dynamic, learning-enabled AI architectures.
Getting Started
If you're considering implementing Graph RAG:
- Start with your schema: Invest time in understanding your domain and designing a thoughtful graph model
- Use tools effectively: Leverage structured output tools like BAML for reliable LLM interactions
- Measure everything: Implement evaluation and monitoring from day one
- Think hybrid: Combine graph traversal with vector search for comprehensive coverage
- Plan for production: Consider maintenance, evolution, and scaling from the beginning
Hands-On Learning Resources
To get hands-on experience with the concepts discussed in this post:
- BAML Dgraph Patient Graph Example: Complete implementation with medical records, geospatial capabilities, and vector embeddings
- Hypermode Knowledge Graph Tutorial: Step-by-step guide to building knowledge graph agents
- Graph Geeks Community: Join the Graph Geeks community for ongoing discussions and learning
- Agentic Workflows for Graph RAG: ODSC Agentic AI Summit 2025 Workshop by GraphGeeks
Graph RAG represents a significant step forward in making AI systems more capable of complex reasoning and contextual understanding. When combined with agentic workflows, it opens up new possibilities for building sophisticated, production-ready AI applications that can handle the nuanced, relationship-rich queries that traditional RAG systems struggle with.
The space is moving quickly, with new tools, techniques, and standards emerging regularly. The key is to start with solid fundamentals while staying engaged with the evolving ecosystem of graph technologies and agentic AI systems.
For more insights on Graph RAG and agentic workflows, join the Graph Geeks community and follow developments in the rapidly evolving intersection of graphs and AI.