APRIL 2 2025
G.V() brings interactive graph visualization to Dgraph
Discover the power of effortless graph data exploration
Graphs are a collection of data objects organized by nodes and relationships. Powered by a graph database, this connections-based approach makes graphs incredibly powerful for complex data analysis. However, understanding these intricate, nuanced connections can be challenging. That is where visualization becomes a game-changer.
We're excited to announce that G.V(), a universal graph database client, now supports Dgraph and Hypermode Graphs, opening up powerful new possibilities for teams working with graph databases.
Why visualization matters in graphs
Visualization plays a crucial role in working with graphs by making complex data structures more accessible, intuitive, and actionable.
Enhanced comprehension and intuition. Graph data structures are inherently complex and nearly impossible to comprehend in raw tabular or text format, especially when they involve multiple relationships. Visualization helps users intuitively understand the connections and patterns within the data It helps instantly show how things are connected, how information flows through an organization, or how different entities interact in a network.
Faster pattern recognition. Graph visualization reveals hidden relationships, clusters, and communities that may not be obvious from raw data. Visualization tools like G.V() render graph data in ways that immediately highlight:
- Clusters of tightly connected nodes
- Outliers or unique connection points
- Hierarchical structures
- Key influencers or central nodes in a network
Revealing hidden relationships, clusters, and communities is particularly useful in applications like fraud detection, recommendation systems, and social network analysis.
Rapid problem solving and data integrity. Visualizing query results allows users to quickly spot inefficiencies in graph traversal or inconsistencies, orphan nodes, or incorrect relationships. This helps in debugging by showing unexpected connections or missing relationships and maintains high-quality knowledge graphs and linked datasets.
Better communication and knowledge sharing across the org. Stakeholders who may not be familiar with graph databases can easily interpret insights, making it easier to justify business decisions and convey findings effectively. Furthermore, interactive exploration enables all users to dynamically navigate the graph, zoom in on specific nodes, filter relationships, and uncover new patterns. This flexibility supports iterative analysis without requiring constant modifications to queries.
Announcing Dgraph support in G.V()
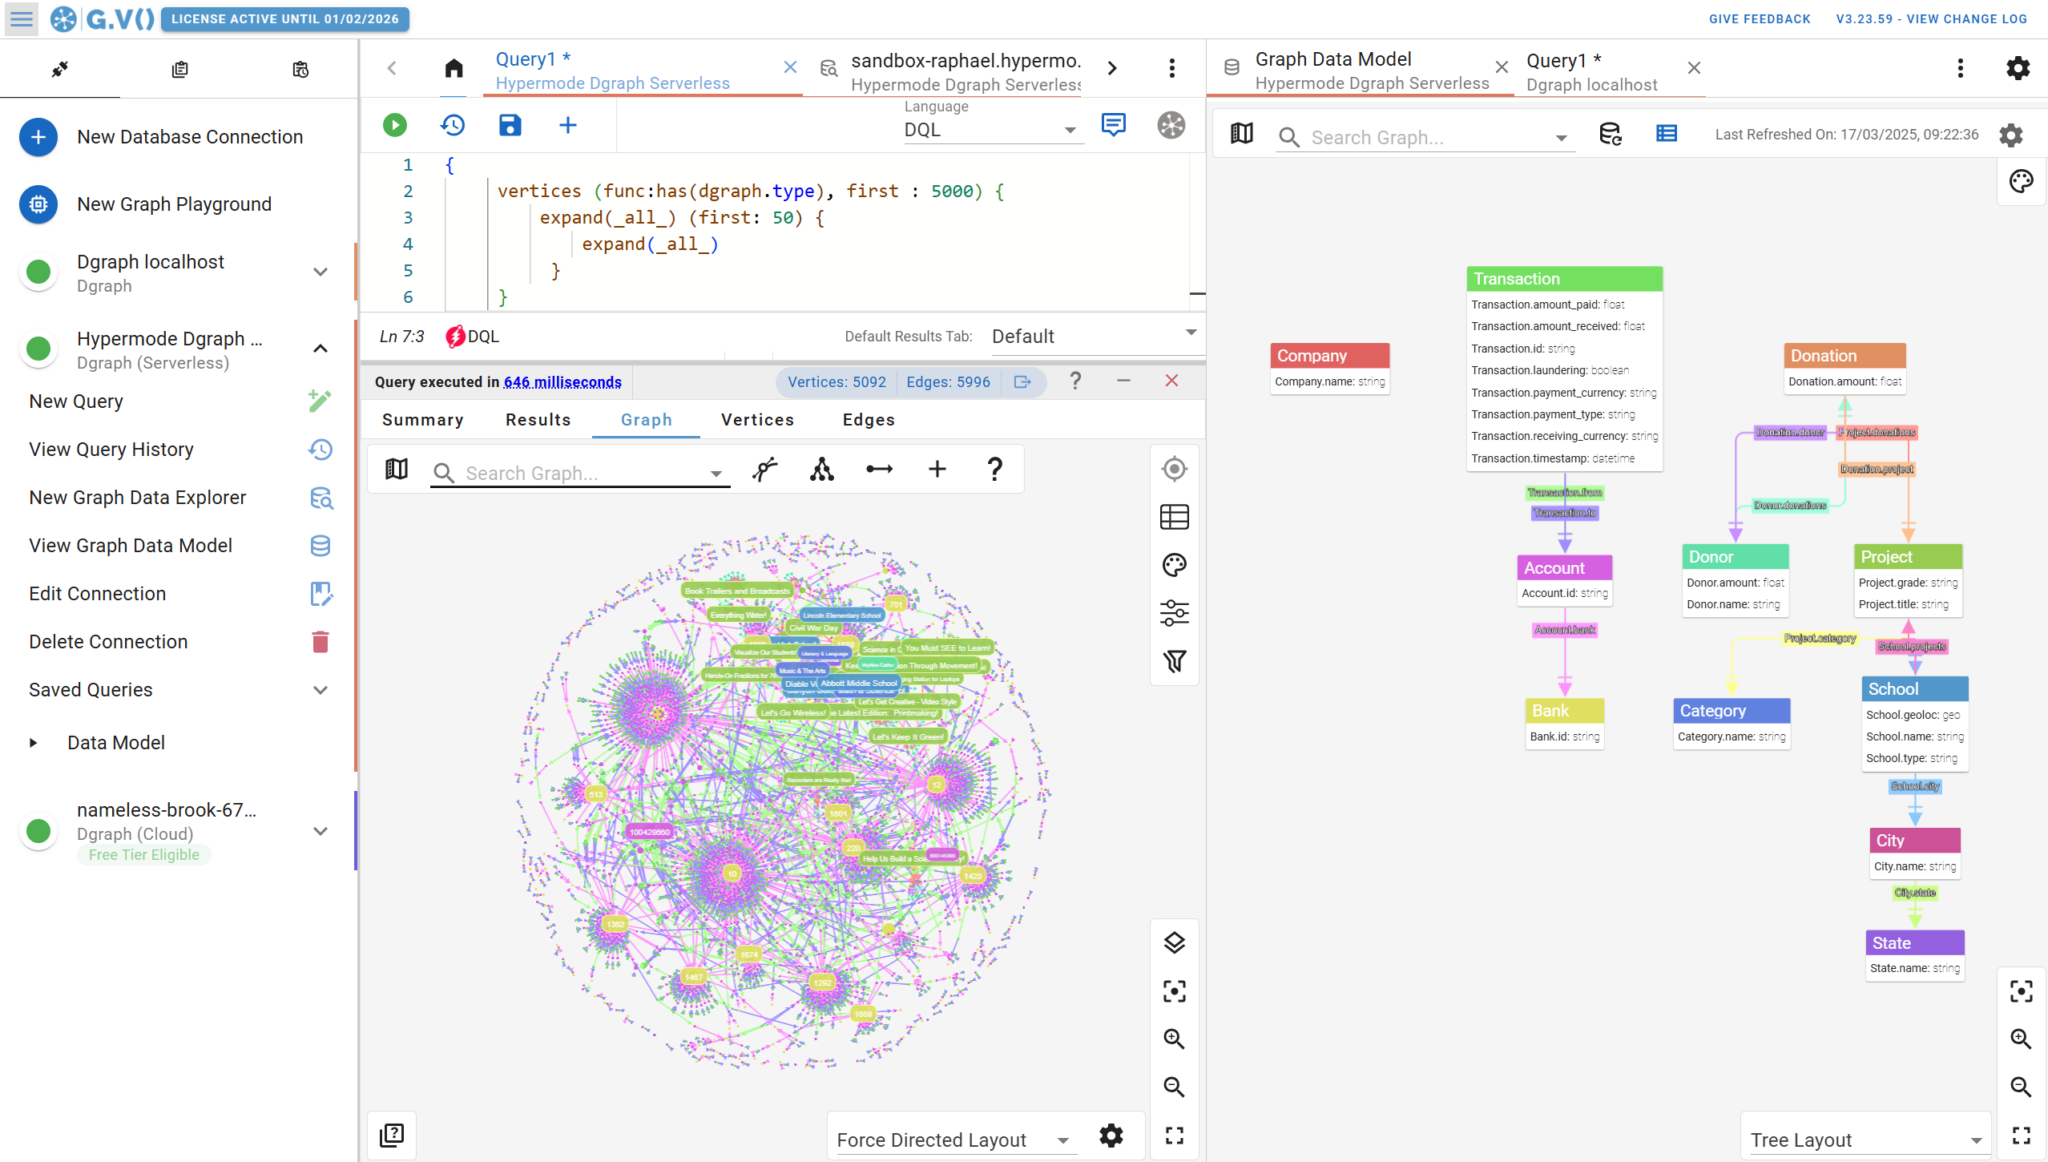
G.V() is an all-in-one graph database client to write, debug, test and analyze results for your Labeled Property Graph (LPG) database. It offers a rich UI with smart autocomplete, graph visualization, editing and connection management. With G.V() you can: connect to your database in less than a minute, view your graph database's schema in 1 click, visualize query results across a variety of formats, and explore your data interactively with the no-code graph database browser.
For Dgraph and Hypermode Graph users, this integration is particularly valuable as a native data source within G.V().
Instant connection. Connect to your Dgraph instance in under a minute. Users can establish connections with just a few clicks, while G.V() supports multiple authentication methods. Developers can create and save connection profiles, allowing quick switching between development, staging, and production databases.
Flexible query support. G.V() provides native support for Dgraph Query Language (DQL), enabling users to execute complex queries. The platform includes intelligent query optimization hints. Developers can leverage query history features to bookmark and revisit important queries, and utilize multiple execution modes that support interactive exploration, batch processing, and performance profiling.
Comprehensive visualization. Explore and visualize your Dgraph data schema with ease. The visualization transforms complex graph data into intuitive, interactive representations. Users can explore their data through multiple dynamic graph layouts, including hierarchical, force-directed, and community-centric views. G.V() offers advanced filtering capabilities, allowing users to zoom, pan, and interact with their data in real-time.
No-code data exploration: This integration requires no specialized graph expertise. The intuitive filtering interface allows users to explore data without writing complex queries. Users can easily generate reports, extract visualizations, and share insights across teams.

What's next
We're actively collaborating with the G.V() team to expand our support. Upcoming features will include:
- DQL syntax validation
- Autocomplete functionality
- Enhanced query editing tools
We’re excited about the new possibilities that Dgraph support in G.V() unlocks for you and your team. Whether you are working on a new proof of concept or managing a mature graph database project, this integration provides the tools you need to succeed with graphs.
Here are some further resources to get you started:
We’re excited to see what you build.